Announcing Grafana Tempo, a massively scalable distributed tracing system
Grafana Labs is proud to announce an easy-to-operate, high-scale, and cost-effective distributed tracing system: Tempo. Tempo is designed to be a robust trace id lookup store whose only dependency is object storage (GCS/S3).
Join us in the Grafana Slack #tempo channel or the tempo-users google group to get involved today!
Why?
At Grafana Labs, we were frustrated with our downsampled distributed tracing system. Finding a sample trace was generally not difficult, but our engineers found themselves repeatedly wanting to find a specific trace.
We wanted our tracing system to be able to always answer questions like: “Why was this customer’s query slow?” “An intermittent bug showed up again. Can I see the exact trace?” We found ourselves wanting 100% sampling, but not wanting to manage the Elasticsearch or Cassandra cluster required to pull it off.
Additionally we found that our tracing backend didn’t need to index our traces. We could discover traces through logs and exemplars. Why pay to index your traces AND your logs AND your metrics? All we needed was a lean, mean traces-by-id storage machine. So we created Tempo.
Tempo is currently ingesting, storing, and retaining for 14 days the entire read path of our production, staging, and development environments. It consumes 170k spans/second around the clock, batches it up, and stores it in GCS.
Grafana integrations
Linking from logs to traces
Loki and other log data sources can be configured to create links from trace ids in log lines. Why be limited to the search capabilities of an existing trace backend? Using logs, you can search by path, status code, latency, user, ip, or anything else you can stuff onto the same log line as a trace id.
Consider a line such as:
path=/api/v1/users status=500 latency=25ms traceid=598083459f85afab userid=4928All of these fields now provide a searchable index for your trace ids in Tempo. You have already invested time and money in your logging system. Leverage it to find traces too!

Linking from metrics to traces
Finally! Open source exemplars are here! Now traces can now be discovered directly from metrics.

Logs allow you to find the exact trace you’re searching for based on logged fields. Exemplars let you find a trace that exemplifies a pattern. You can have links to traces based on your metrics query directly embedded in your Grafana graph. Call up p99s, 500 error codes, specific endpoints using a Prometheus query, and all of your traces now become relevant examples of the pattern you’re looking at.
Linking from traces to everything else!
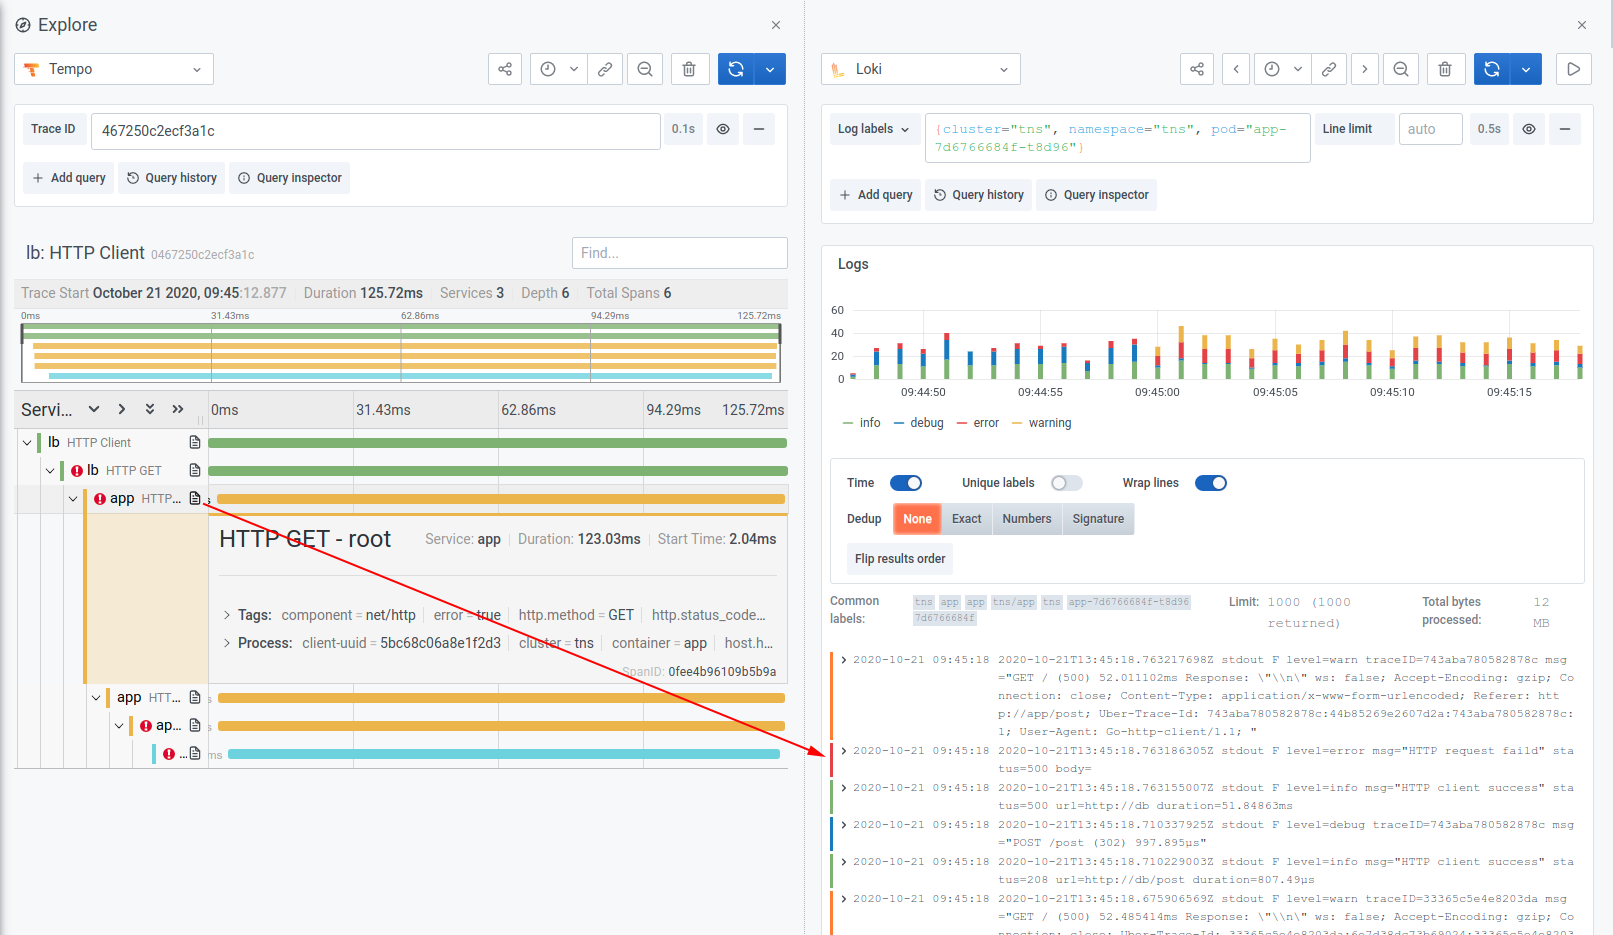
Exemplars and logs for discovery and Tempo for…well…storing everything without worrying about the bill. Let’s go one step further and add new ways to link our observability data. How about linking from a trace back into logs? The Grafana Agent allows us to decorate our traces, logs, and metrics with consistent metadata, which then creates correlations that were not previously possible.
After jumping from an exemplar to a trace, an operator is now able to go directly to the logs of the struggling service!

The trace immediately identifies what element of your request path caused the error, and the logs help you identify why.
Let’s go!
If you’re looking to increase the number of traces you ingest and store at a fraction of the cost of your current system… If you’re ready to use logs and exemplars to drastically increase the flexibility of searching your distributed tracing backend… If you’re drooling over Grafana integrations that seamlessly link your metrics, logs, and traces…. Then maybe it’s time to switch to a new backend and help your operators maintain… Tempo.
Join us in the Grafana Slack #tempo channel or the tempo-users google group, and watch our ObservabilityCon session, “Tracing made simple with Grafana,” on demand, for a deeper dive into Tempo! You can get free open-beta access to Tempo on Grafana Cloud. We have new free and paid Grafana Cloud plans to suit every use case — sign up for free now.


