ObservabilityCON 2020: Your guide to the newest announcements from Grafana Labs

This morning during the ObservabilityCON keynote, we announced some of the exciting projects and feature enhancements we’ve been working on for our customers and community. And it doesn’t end there. Throughout the week, we’ll continue to unveil new features, go deeper with live demos, and share our plans to shape the future of observability. With so many new announcements and features to check out, we want to make sure you know where to get more details about these developments. Here is your guide to all of the newest announcements from Grafana Labs.

Logs
Join us Wednesday, October 28, at 16:00 UTC for the session on Observability with logs & Grafana to learn more about our latest major release, Loki 2.0, and how you can optimize your existing logging solutions with Grafana.
Loki 2.0
Since it was announced less than a year ago, it’s been exciting to watch Loki gain adoption in the community with more than 20k active installs. We’ve been working hard on Loki 2.0 to help our users improve performance and reduce dependencies, so we can continue to provide an awesome logging solution for everyone who relies on Loki today as well future users.
Today’s major release includes improvements to the Loki query language. In Loki 2.0, users can now transform the logs and extract additional labels, enabling more filtering and grouping. And now, transformations are possible across all of your log contents — whether it’s in log format, a JSON log line, structured or unstructured. With the query tools available in 2.0, users can transform logs across any of those formats, and normalize them to do more complicated querying on top of that data — without having to define labels in advance and store those labels in the database.
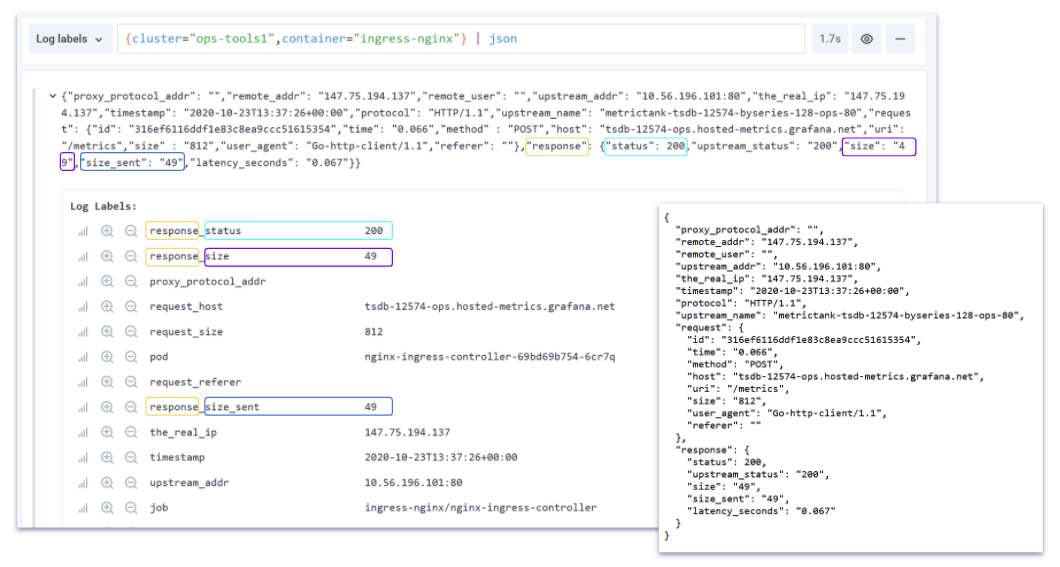
In the example above, you can see how easy it is to parse key value pairs out of a JSON log line and turn them into labels that can be filtered.
The big benefit: Loki remains cost-efficient and easy-to-use while now providing the ability to query, analyze, and aggregate your log data in ways only limited by your imagination.
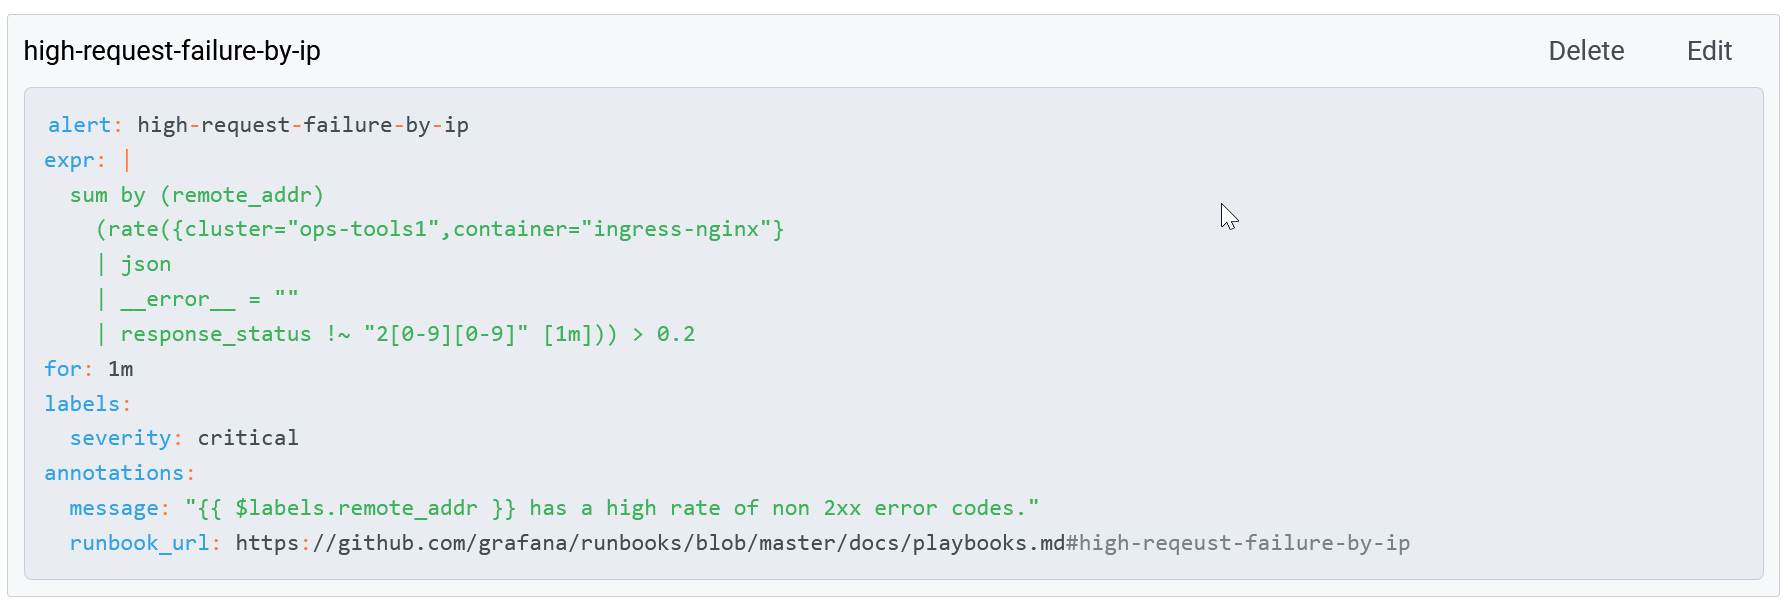
Previously, in order to make alerts with Loki, you would configure Loki as a Prometheus data source and point Grafana to use that to generate Grafana alerts. In Loki 2.0, we’ve integrated a distributed rules evaluation engine so that you can write any Loki 2.0 query to generate an alert statement.

Traces
Join us Wednesday, October 28, at 17:40 UTC for the session on Tracing made simple with Grafana to learn more about our new distributed tracing backend, Grafana Tempo, and tracing with Grafana.
Grafana Tempo
Grafana Tempo is our new open source, easy-to-use, and high-scale distributed tracing backend. Compared to other solutions available in the market today, it requires only object storage like S3 or GCS, making it extremely cost-efficient.
Designed for seamlessly correlating metrics, logs, and traces, Grafana Tempo enables users to troubleshoot faster by narrowing in a specific trace. It is deeply integrated with Grafana, Prometheus, and Loki. Grafana Agent provides support for Tempo, using the same service discovery as Prometheus and Loki.
Tempo can be used with any of the open source tracing protocols, including Jaeger, Zipkin, and OpenTelemetry.


Grafana
Watch the on-demand video of the Grafana: The open and composable observability platform session to learn more about the latest features and enhancements in Grafana.
Grafana 7.3
As we continue to expand our offerings, we know it’s important to maintain a cohesive experience across all of our different project and commercial offerings. Which is why a big emphasis of Grafana 7.3 was to make sure there was a seamless experience between Grafana and Tempo with exemplars. Exemplars let you find a trace that exemplifies a pattern and accelerate the debugging process by allowing you to jump straight from metrics to relevant traces to specific logs.
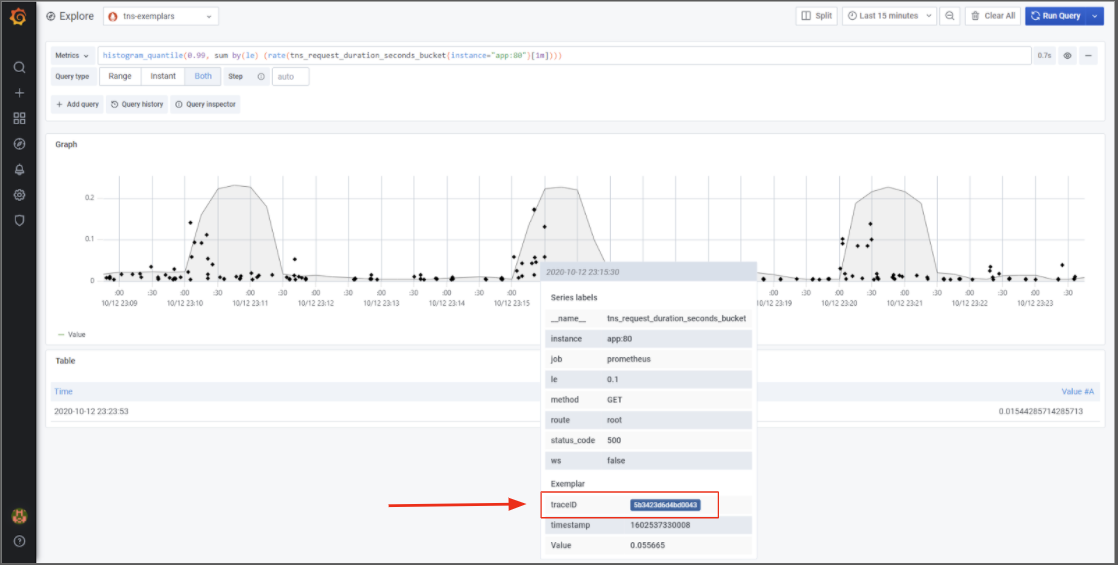
Traces can now be discovered directly from your metrics.
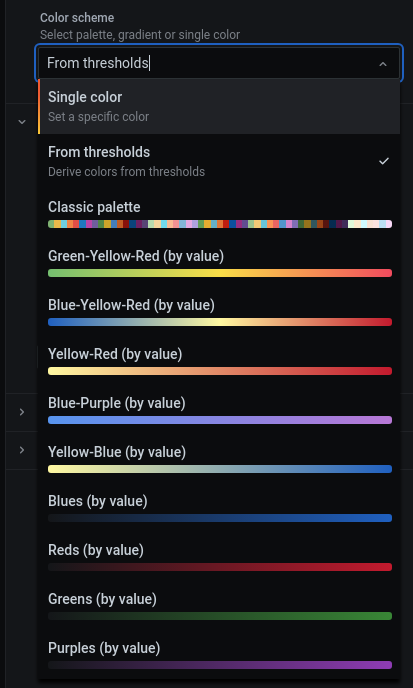
That’s not to say it was the only focus…. 7.3 also includes some really cool new features like gradient color palettes for visualization to personalize your dashboard. There is also a new cell hover in the table panel, more transformations, better exporting features, performance improvements for Cloudwatch, and more!
Plugins
A key part of our observability strategy is working with our customers and community to extend Grafana with various data source plugins, so you can compose your observability solution to include data from whichever tools you’re currently using. We’ll be highlighting some of these new plugins throughout the week to show you how to use them to gain more insight from your data in Grafana.
See the recently announced plugins:
- Wavefront
- GitHub
- Snowflake
- MongoDB
- We also made some updates to the Oracle, ServiceNow and Dynatrace plugins.
Additionally, now all enterprise plugins support alerting, since they have been re-written to include backend components. That means you can create Grafana alerts based on data from any Enterprise plugin, like Datadog, New Relic, Oracle, and AppDynamics.
Data source usage insights
If you’re a part of a distributed team, or responsible for a large organization, it can be challenging to know where to apply effort to fix problems or if they’re even necessary. Usage insights used to be limited to dashboards. With data source usage insights, you can track data sources’ query count, query duration, and error count to understand how data sources are used and to keep them reliable and performant.

Data source usage insight is only available for customers with a license to Grafana Enterprise.
Audit logs
Grafana users access all kinds of sensitive information in logs and metrics. With audit logs, you can keep a record of user actions to manage and mitigate suspicious activity and meet compliance requirements. This way, you and your teams can share that sensitive information in Grafana with greater confidence.

Audit logs are only available for customers with a license to Grafana Enterprise.
SAML authentication
Now available for Grafana Enterprise customers, the new SAML authentication integration allows you to log in by using an external SAML 2.0 Identity Provider (IdP). To enable this, Grafana becomes a Service Provider (SP) in the authentication flow, interacting with the IdP to exchange user information. Check out our documentation to learn how to set up and start using SAML authentication.
SAML authentication is only available for customers with a license to Grafana Enterprise.
Faster time-to-dashboard with Grafana Cloud
A newly added guided wizard makes it easy to get started with Grafana Cloud. You’ll find instructions to easily install the cloud agent and effortlessly configure pre-built dashboards with live metrics and alerts, and an additional interface to easily manage the installation of these dashboards.

Grafana Cloud Alerting
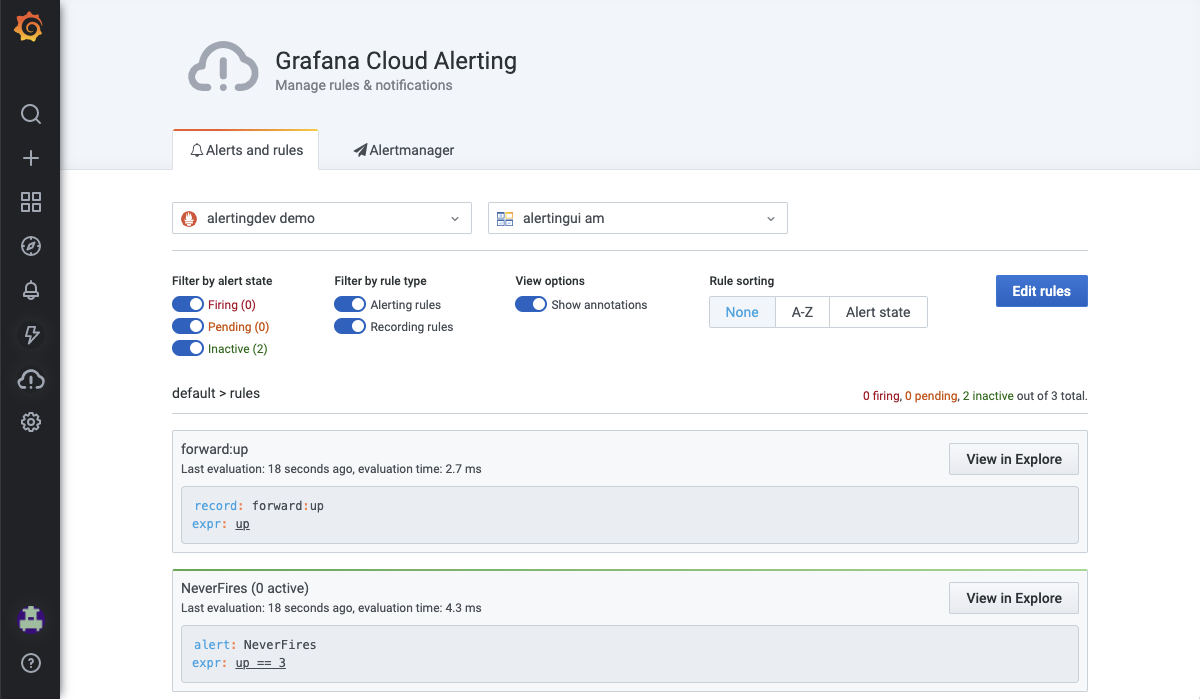
Over the last few weeks, we’ve been rolling out an exciting update that makes alerting with Grafana Cloud so much more enjoyable. The best part: It’s dead simple and super effective. You can find it in the brand-new icon in the side navigation: Grafana Cloud Alerting.
As soon as you’re up and running with Grafana Cloud, all the power of Prometheus-style alerting and recording rules are right at your fingertips: no additional tooling, no downloads, and no command line foo necessary. You’ll be able to view all of your rules in one place; it’s pretty familiar if you’ve interacted with these kinds of alerts before. Even better, you’ll also be able to create, update, and delete all of these rules from this same page without ever having to touch a single configuration file (though you still can if you want to!), so you don’t ever have to worry about switching context. You’ll even be able to update your Alertmanager configurations from here, too.

Metrics
Join us Tuesday, October 27, at 16:00 UTC for the The evolution of Prometheus observability session to learn more about Prometheus, Cortex, and Grafana Metrics Enterprise.
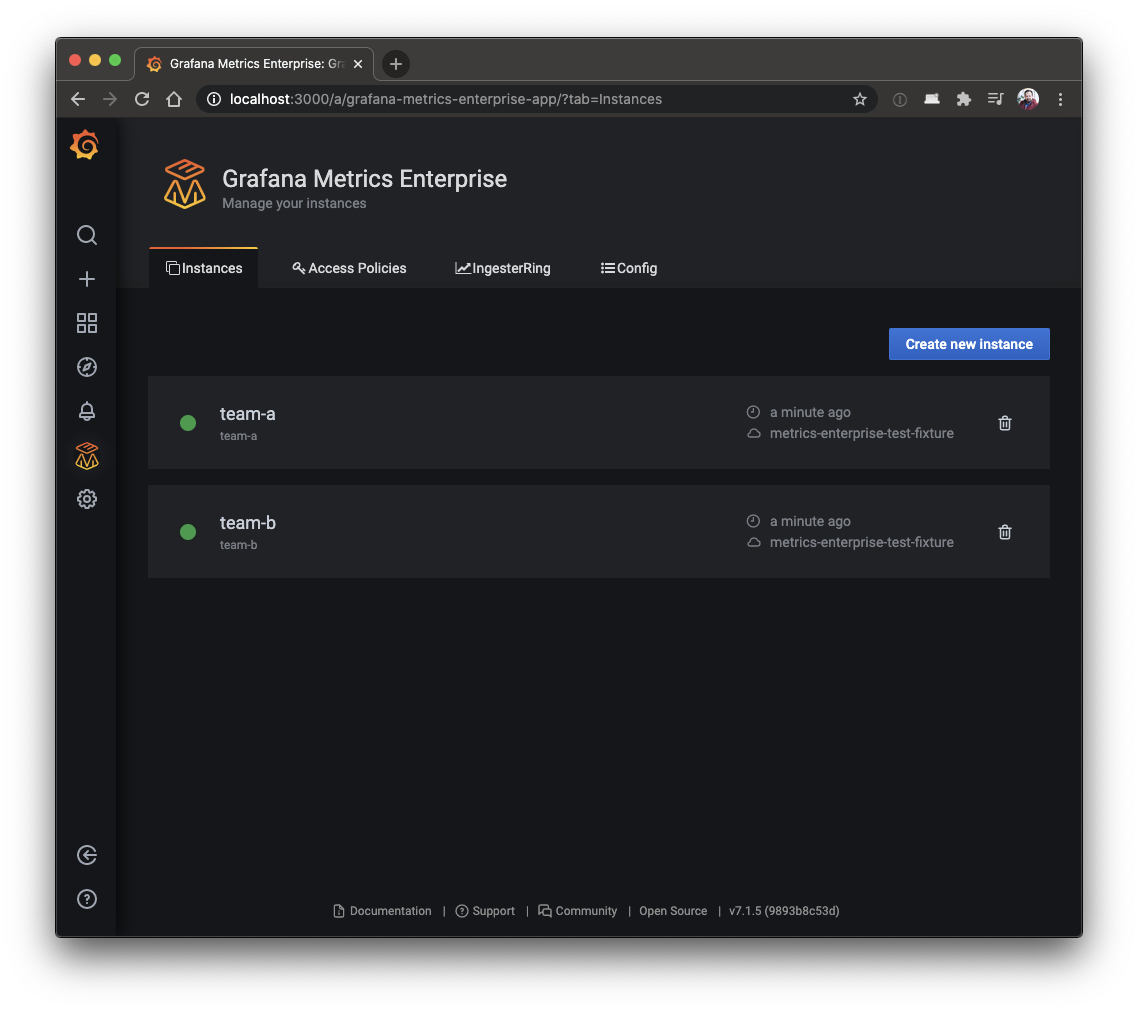
Grafana Metrics Enterprise
Our latest product offering, Grafana Metrics Enterprise (GME), is built on Cortex and provides a simple and scalable solution that enables Prometheus-as-a-Service for large organizations running at scale.
It’s the first of its kind: a Prometheus-as-a-Service solution designed for large companies that provides some key features for any organization attempting to scale out its current Prometheus installation.
