Learn Grafana: Share query results between panels to reduce load time
As you add more panels to your dashboard, more requests are being made, potentially leading to your dashboard taking longer to load. While you can limit the data requested in each query, one of the best ways to reduce the loading time is to reduce the number of requests being made to the data source.
Grafana makes a data source query for each panel in your dashboard, even if those queries are identical. And even if they’re not, making a single query for all the data might be more efficient than making many small queries.
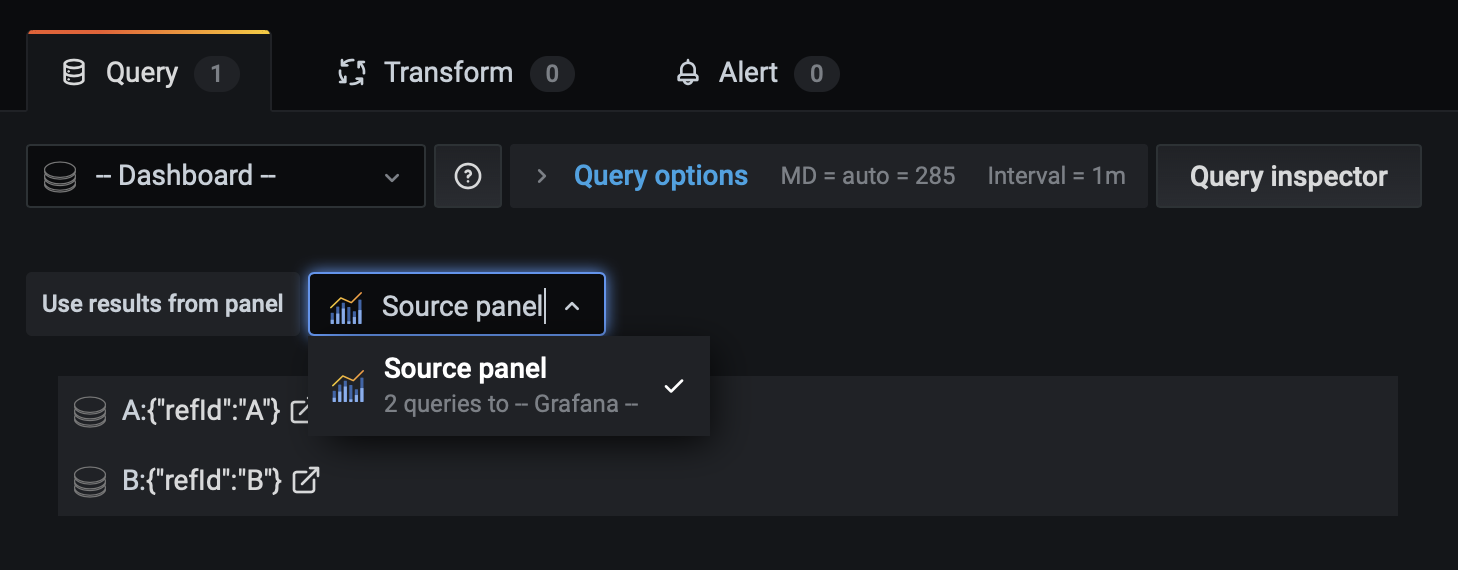
Luckily, Grafana allows you to share the query result from another query in your dashboard, using the Dashboard data source. It’s available by default, and you can select it from the data source drop-down in the query editor.
The Dashboard data source lets you select a panel in your dashboard that contains the queries you want to share. This can drastically reduce the number of queries being made when you, for example, have several panels visualizing the same data.
Before we can use the Dashboard data source, we first need to create the panel with a query we can share. If you don’t have one yet, you can create one with the built-in Grafana data source for now.
Create another panel and select Dashboard data source in the query editor. In the Use results from panel list, select the first panel you created.

All queries defined in the source panel are now available to the new panel. Queries made in the source panel can be shared with multiple panels. You can click on any of the queries to go to the panel where they are defined.
You can share query results with any number of panels, meaning you can potentially create complex dashboards that only make a single query on each refresh. I encourage you to take a look at your existing dashboard. If the queries are identical, switch over to the Dashboard data source to get a free performance boost.
For more information on how to share queries within a dashboard, check out the docs.


