
Load testing with GitLab
By integrating performance tests into your CI pipelines, you can catch performance issues earlier and ship more stable and performant applications to production. In this tutorial, we walk through how to integrate performance testing into your GitLab setup with Grafana k6.
You’ll learn how to integrate load testing with k6 into GitLab, how to detect performance issues earlier, and when to use different types of implementation paths.
Prerequisites
- k6, an open source load testing tool for testing the performance of APIs, microservices, and websites.
- GitLab, a complete DevOps platform, including a CI/CD toolchain and many more features.
The examples in this tutorial can be found here.
Write your performance test script
For the sake of this tutorial, we will create a simple k6 test for our demo API. Feel free to change this to any of the API endpoints you are looking to test.
The following test will run 50 VUs (virtual users) continuously for one minute. Throughout this duration, each VU will generate one request, sleep for 3 seconds, and then start over.
import { sleep } from 'k6';
import http from 'k6/http';

export const options = {
  duration: '1m',
  vus: 50,
};

export default function () {
  http.get('http://test.k6.io/contacts.php');
  sleep(3);
}
You can run the test locally using the following command. Just make sure to install k6 first.
k6 run performance-test.jsThis produces the following output:
          /\      |‾‾|  /‾‾/  /‾/
     /\  /  \     |  |_/  /  / /
    /  \/    \    |      |  /  ‾‾\
   /          \   |  |‾\  \ | (_) |
  / __________ \  |__|  \__\ \___/ .io

  execution: local
     script: performance-test.js
     output: -

  scenarios: (100.00%) 1 executors, 50 max VUs, 1m30s max duration (incl. graceful stop):
           * default: 50 looping VUs for 1m0s (gracefulStop: 30s)


running (1m02.5s), 00/50 VUs, 1000 complete and 0 interrupted iterations
default ✓ [======================================] 50 VUs  1m0s


    data_received..............: 711 kB 11 kB/s
    data_sent..................: 88 kB  1.4 kB/s
    http_req_blocked...........: avg=8.97ms   min=1.37µs   med=2.77µs   max=186.58ms p(90)=9.39µs   p(95)=8.85ms
    http_req_connecting........: avg=5.44ms   min=0s       med=0s       max=115.8ms  p(90)=0s       p(95)=5.16ms
    http_req_duration..........: avg=109.39ms min=100.73ms med=108.59ms max=148.3ms  p(90)=114.59ms p(95)=119.62ms
    http_req_receiving.........: avg=55.89µs  min=16.15µs  med=37.92µs  max=9.67ms   p(90)=80.07µs  p(95)=100.34µs
    http_req_sending...........: avg=15.69µs  min=4.94µs   med=10.05µs  max=109.1µs  p(90)=30.32µs  p(95)=45.83µs
    http_req_tls_handshaking...: avg=0s       min=0s       med=0s       max=0s       p(90)=0s       p(95)=0s
    http_req_waiting...........: avg=109.31ms min=100.69ms med=108.49ms max=148.22ms p(90)=114.54ms p(95)=119.56ms
    http_reqs..................: 1000   15.987698/s
    iteration_duration.........: avg=3.11s    min=3.1s     med=3.1s     max=3.3s     p(90)=3.12s    p(95)=3.15s
    iterations.................: 1000   15.987698/s
    vus........................: 50     min=50 max=50
    vus_max....................: 50     min=50 max=50
Configure thresholds
The next step in this load testing example is to add your service-level objectives (SLOs) for the performance of your application. SLOs are a vital aspect of ensuring the reliability of your systems and applications. If you do not currently have any defined SLAs or SLOs, now is a good time to start considering your requirements.
You can then configure your SLOs as pass/fail criteria in your test script using thresholds. k6 evaluates these thresholds during the test execution and informs you about its results.
If a threshold in your test fails, k6 will finish with a non-zero exit code, which communicates to the CI tool that the step failed.
Now, we add one threshold to our previous script to validate that the 95th percentile response time is below 500ms. After this change, the script will look like this:
import { sleep } from 'k6';
import http from 'k6/http';

export const options = {
  duration: '1m',
  vus: 50,
  thresholds: {
    http_req_duration: ['p(95)<500'], // 95 percent of response times must be below 500ms
  },
};

export default function () {
  http.get('http://test.k6.io/contacts.php');
  sleep(3);
}
Thresholds are a powerful feature providing a flexible API to define various types of pass/fail criteria in the same test run. For example:
- The 99th percentile response time must be below 700 ms.
- The 95th percentile response time must be below 400 ms.
- No more than 1% failed requests.
- The content of a response must be correct more than 95% of the time.
- Your condition for pass/fail criteria (SLOs)
Configure GitLab CI
In the root of your project folder, create a file with the name .gitlab-ci.yml. This configuration file will trigger the CI to build whenever a push to the remote repository is detected. If you want to know more about it, check out the tutorial: Getting started with GitLab CI/CD.
stages:
  - build
  - deploy
  - loadtest-local

image:
  name: ubuntu:latest

build:
  stage: build
  script:
    - echo "building my application in ubuntu container..."

deploy:
  stage: deploy
  script:
    - echo "deploying my application in ubuntu container..."

loadtest-local:
  image:
    name: grafana/k6:latest
    entrypoint: ['']
  stage: loadtest-local
  script:
    - echo "executing local k6 in k6 container..."
    - k6 run ./loadtests/performance-test.js
Note that we use the k6 Docker image in the above configuration file. For other ways to install k6, check out the k6 installation documentation.
Eventually, your repository should look like the following screenshot. You can also fork the k6-gitlab-example repository.

Click on the Build -> Jobs section of the sidebar menu.
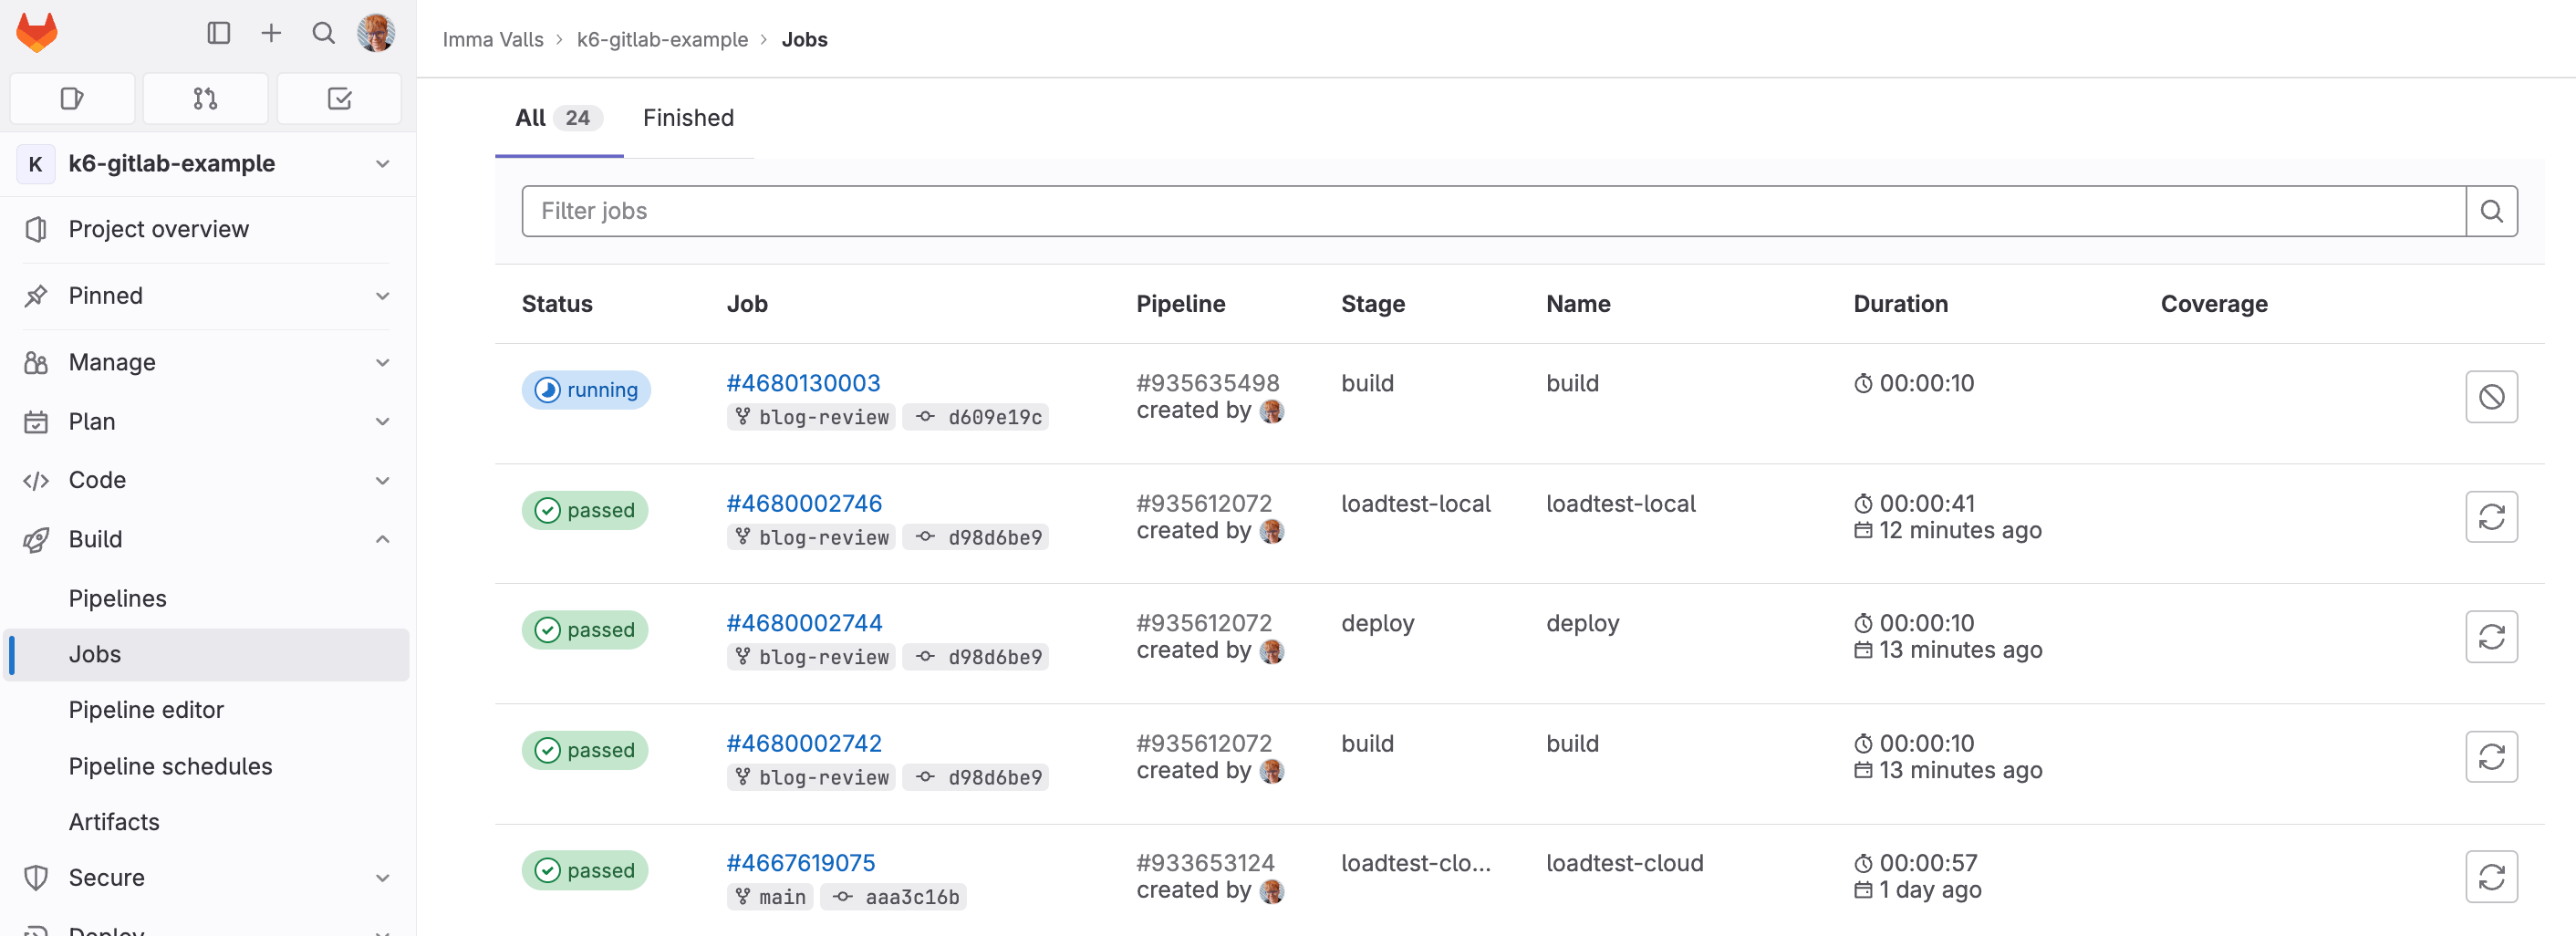
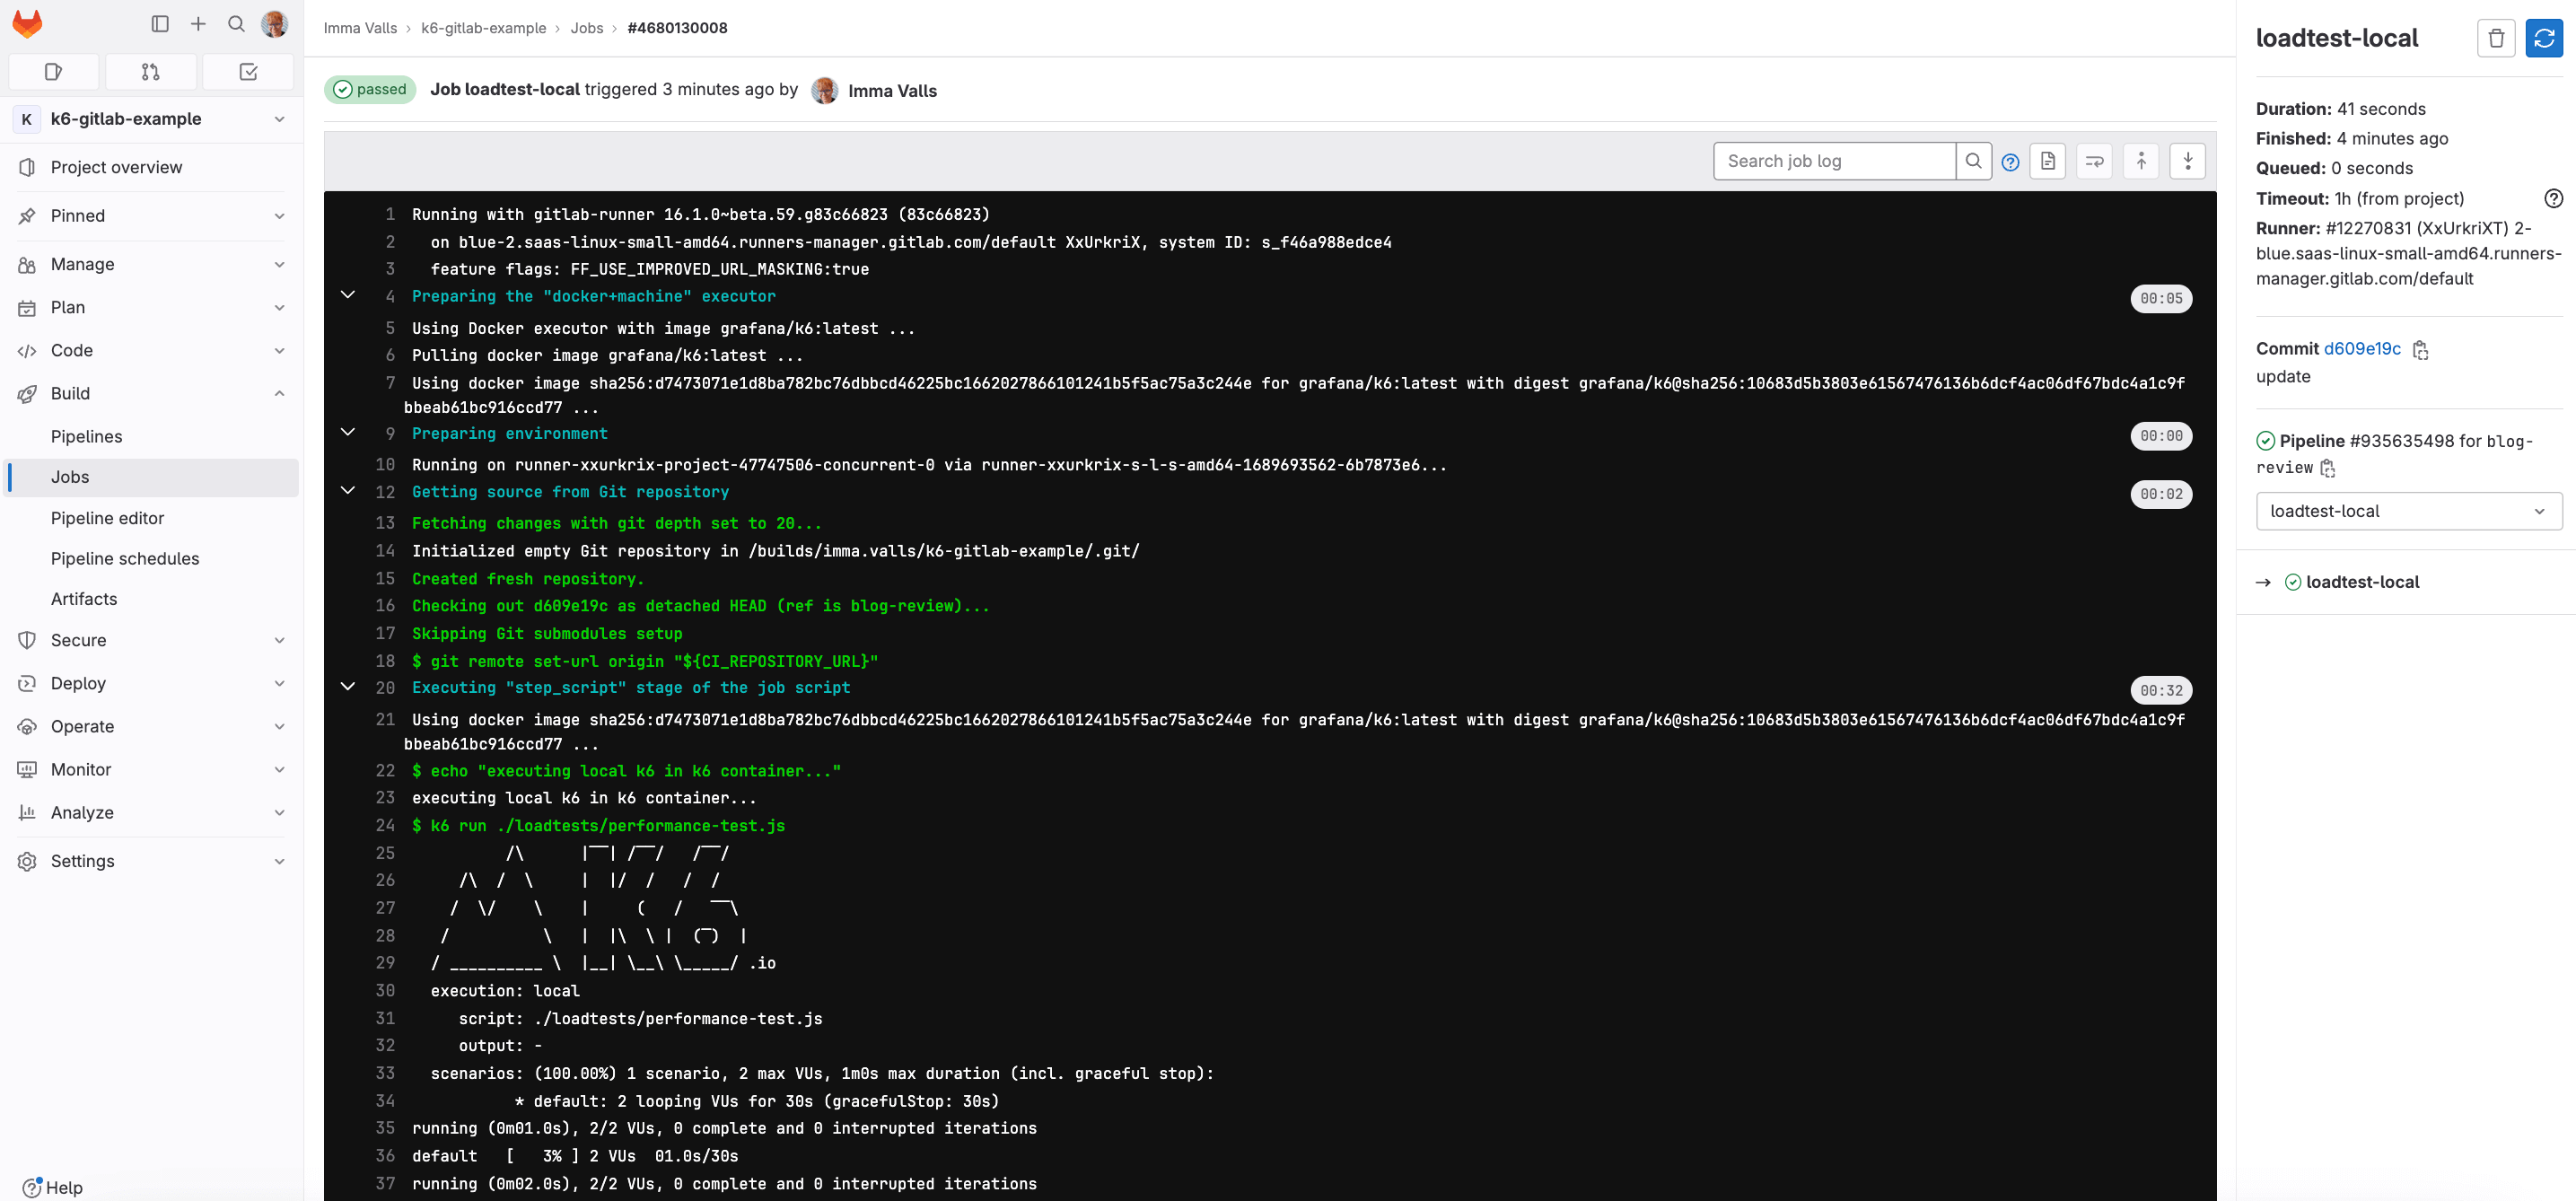
On this page, you will have your initiated jobs running. Click on the specific job to watch the test run and see the results when it is finished. Below is the succeeded job:
Running cloud tests
There are two common ways to run k6 tests as part of a CI process:
k6 runto run a test locally on the CI server.k6 cloudto run a test on Grafana Cloud k6 from one or multiple geographic locations.
You might want to trigger cloud tests in these common cases:
- If you want to run a test from one or multiple geographic locations (load zones).
- If you want to run a test with high load that will need more compute resources than provisioned by the CI server.
If any of those reasons fits your needs, then running cloud tests is the way to go for you.
Before we start with the GitLab configuration, it is good to familiarize ourselves with how cloud execution works, and we recommend you test how to trigger a cloud test from your machine.
Check out the guide to running cloud tests from the CLI to learn how to distribute the test load across multiple geographic locations and more information about the cloud execution.
Now, we will show how to trigger cloud tests from GitLab CI. If you do not have an account with Grafana Cloud already, you can sign up for a free account today. After that, copy your token. You also need your project ID to be set as an environment variable. The project ID is visible under the project name in project page.
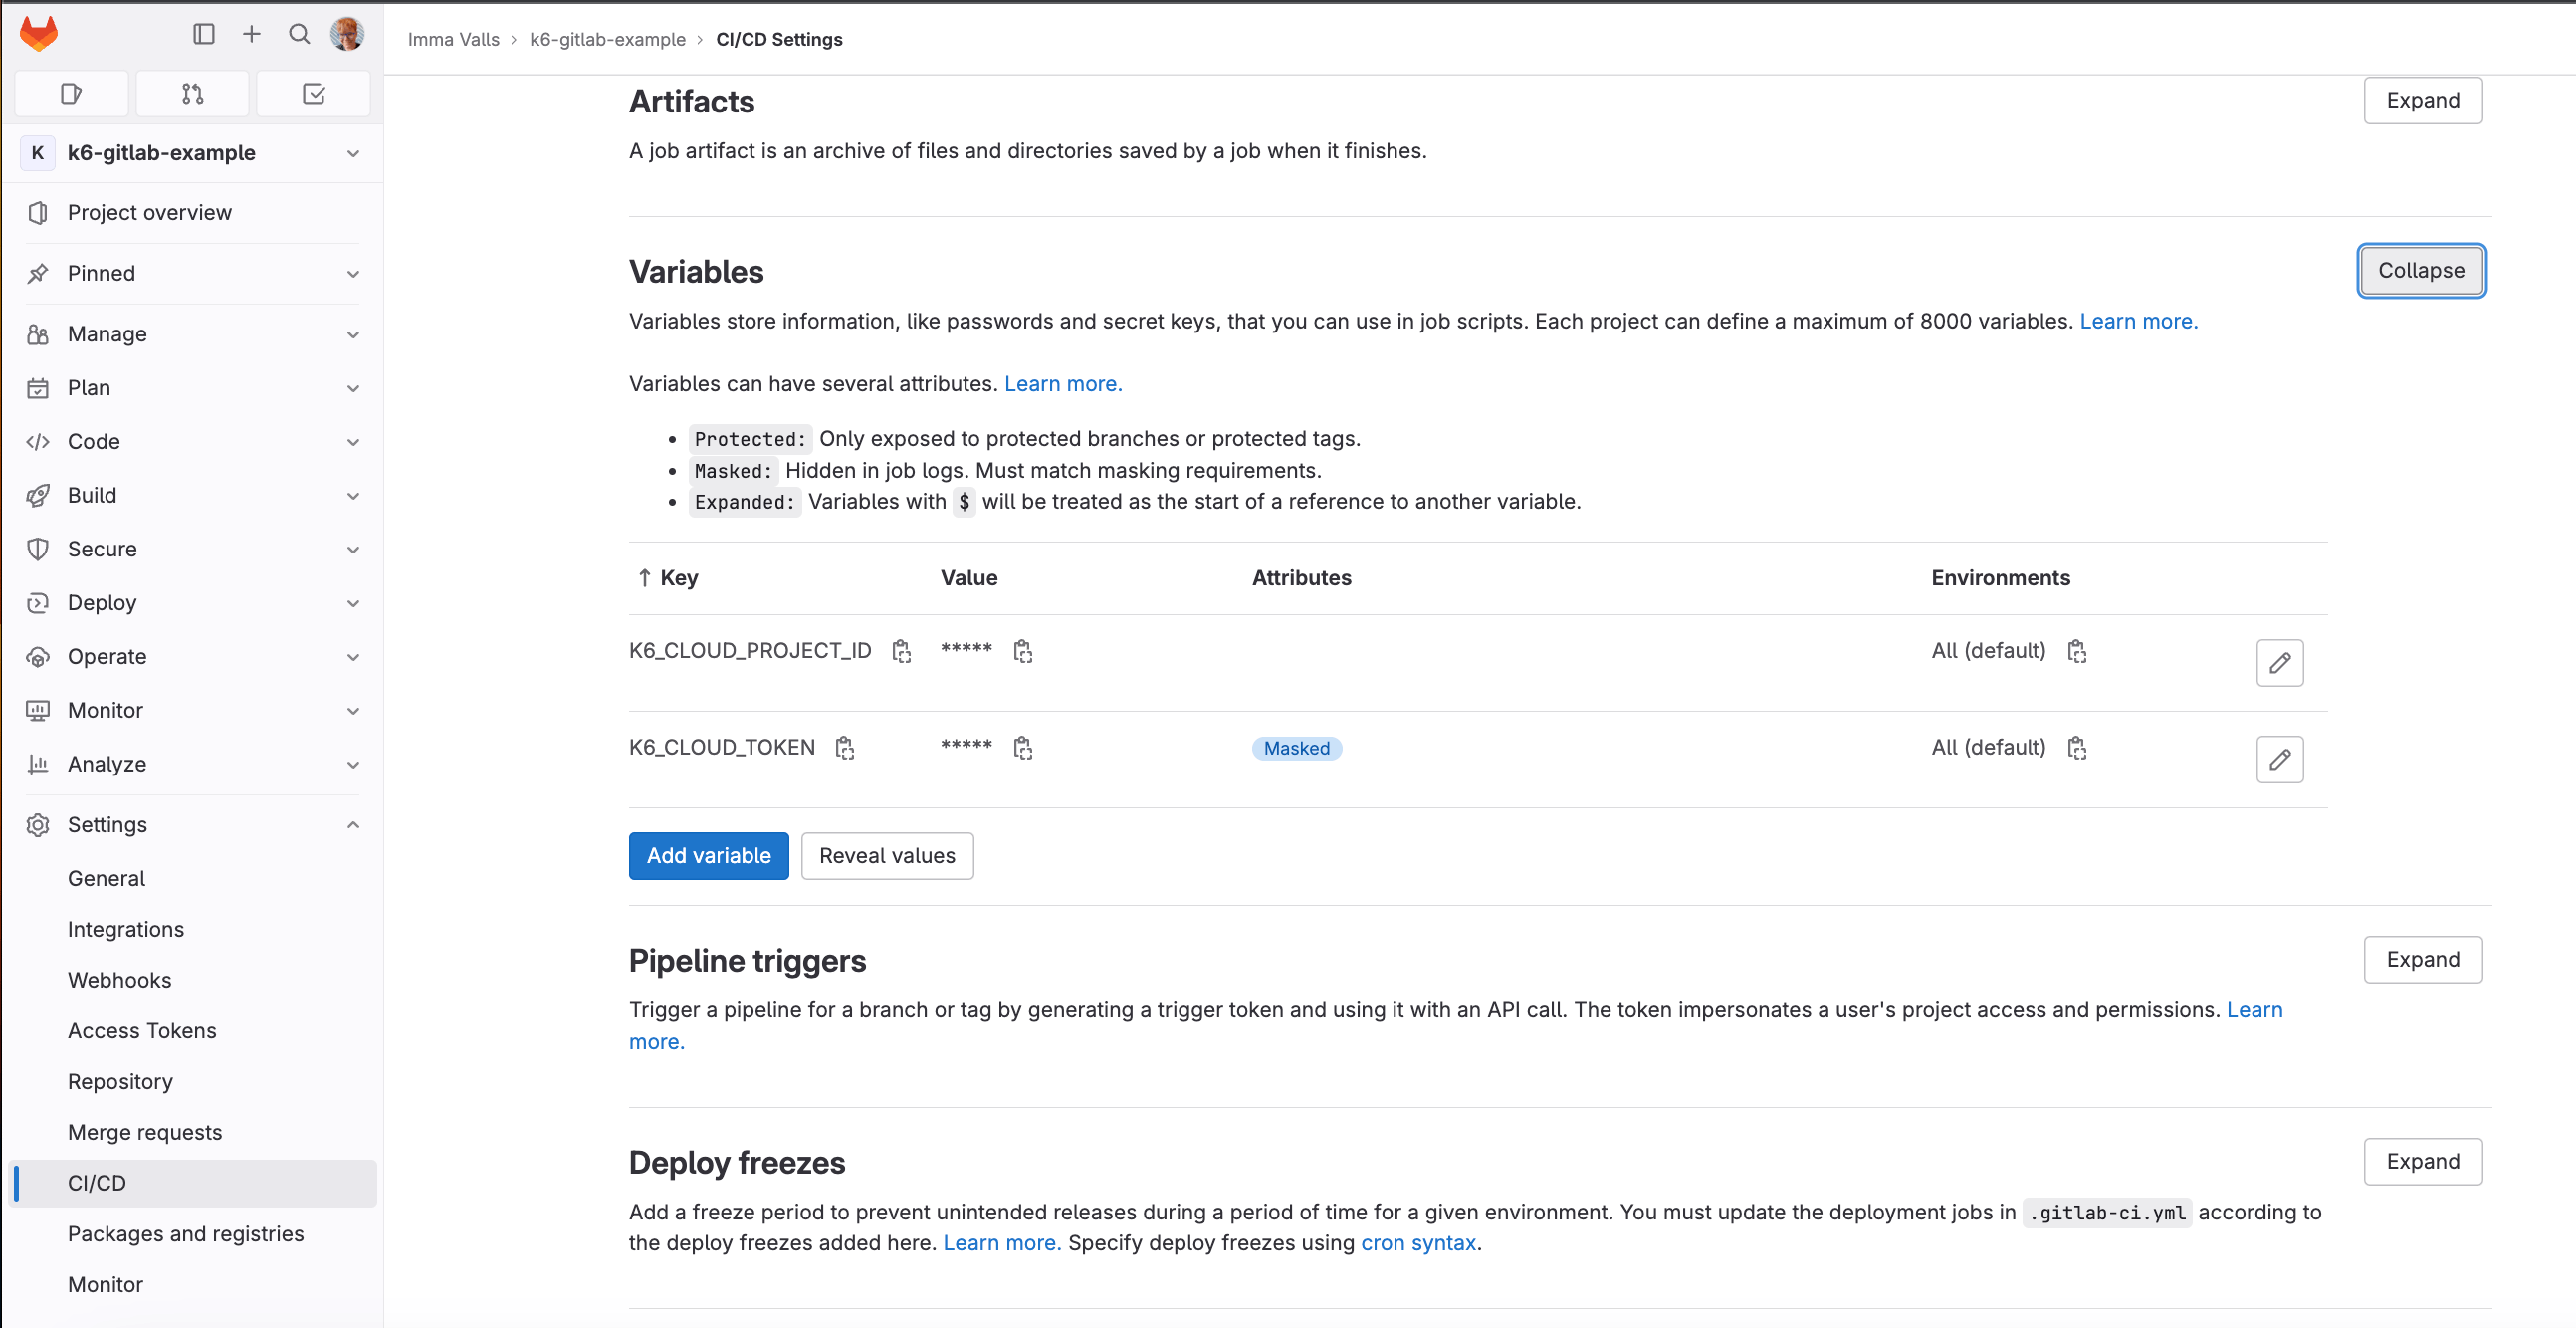
Navigate to Settings -> CI/CD of GitLab repository and expand variables. When GitLab runs a job, the K6_CLOUD_TOKEN environment variable will automatically authenticate you to the cloud service. You also need to set the K6_CLOUD_PROJECT_ID to your project ID. Refer to define a custom CI/CD variable in the UI guide for more information.
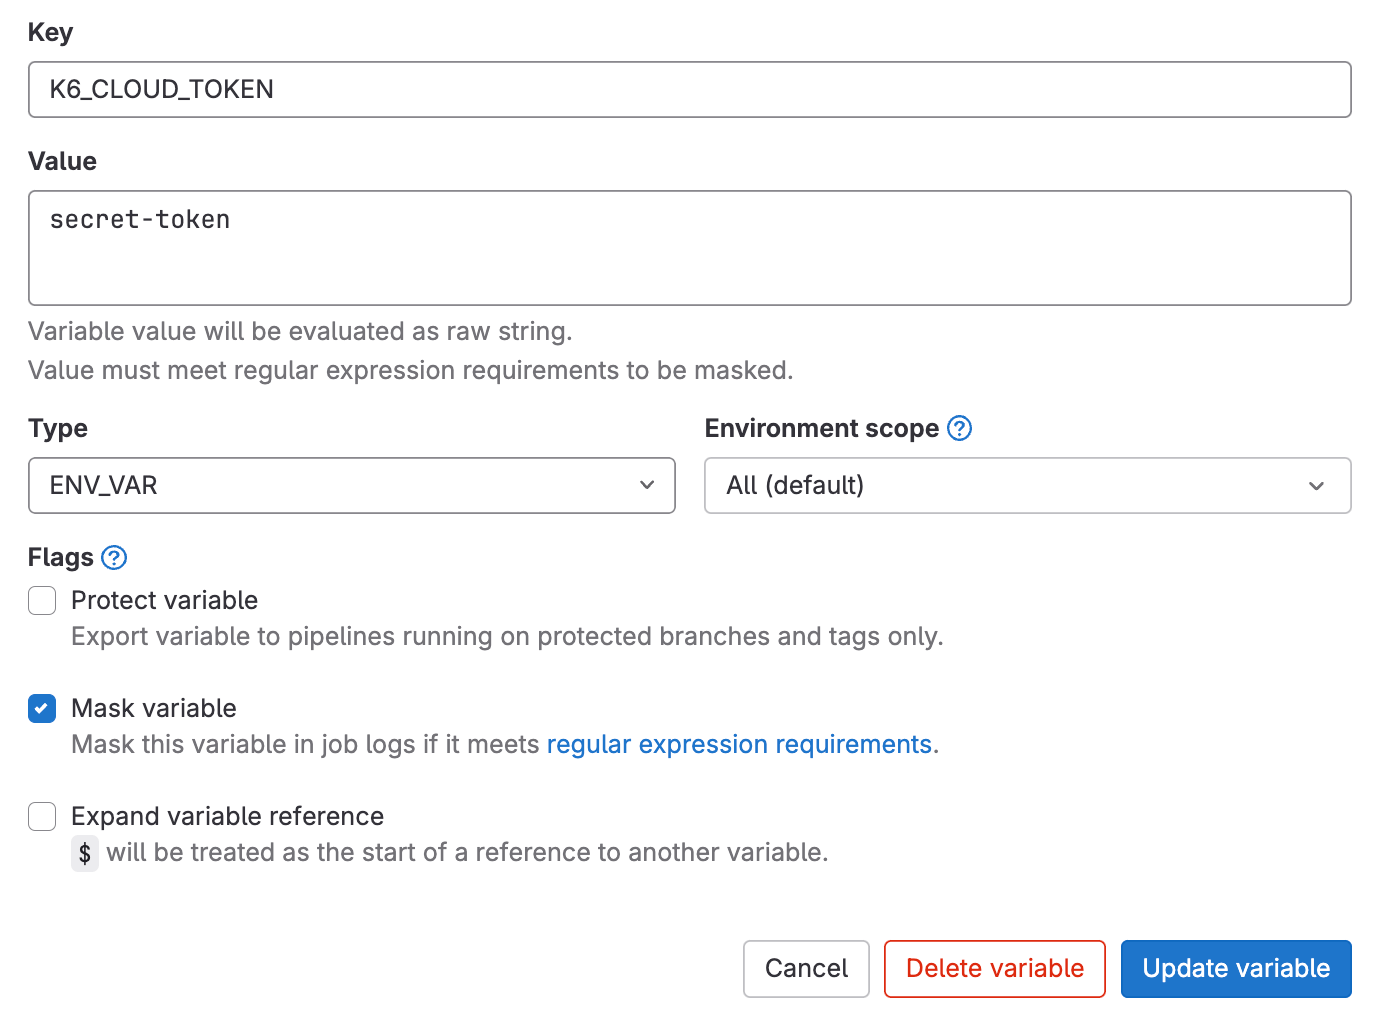
Ensure you uncheck the flag Protect variable if you run the example in an unprotected branch.
Now, you have to update the previous .gitlab-ci.yml file. It will look something like:
stages:
  - build
  - deploy
  - loadtest-local
  - loadtest-cloud

image:
  name: ubuntu:latest

build:
  stage: build
  script:
    - echo "building my application in ubuntu container..."

deploy:
  stage: deploy
  script:
    - echo "deploying my application in ubuntu container..."

loadtest-local:
  image:
    name: grafana/k6:latest
    entrypoint: ['']
  stage: loadtest-local
  script:
    - echo "executing local k6 in k6 container..."
    - k6 run ./loadtests/performance-test.js

loadtest-cloud:
  image:
    name: grafana/k6:latest
    entrypoint: ['']
  stage: loadtest-cloud
  script:
    - echo "executing cloud k6 in k6 container..."
    - k6 cloud ./loadtests/performance-test.js
The change, compared to the previous configuration, is that we added a loadtest-cloud stage that uses the k6 cloud command to trigger cloud tests.
With that done, we can now go ahead and push the changes we’ve made in .gitlab-ci.yml to our GitLab repository. This subsequently triggers GitLab CI to build our new jobs. When all is done and good, we should see a screen like this from the GitLab jobs page:
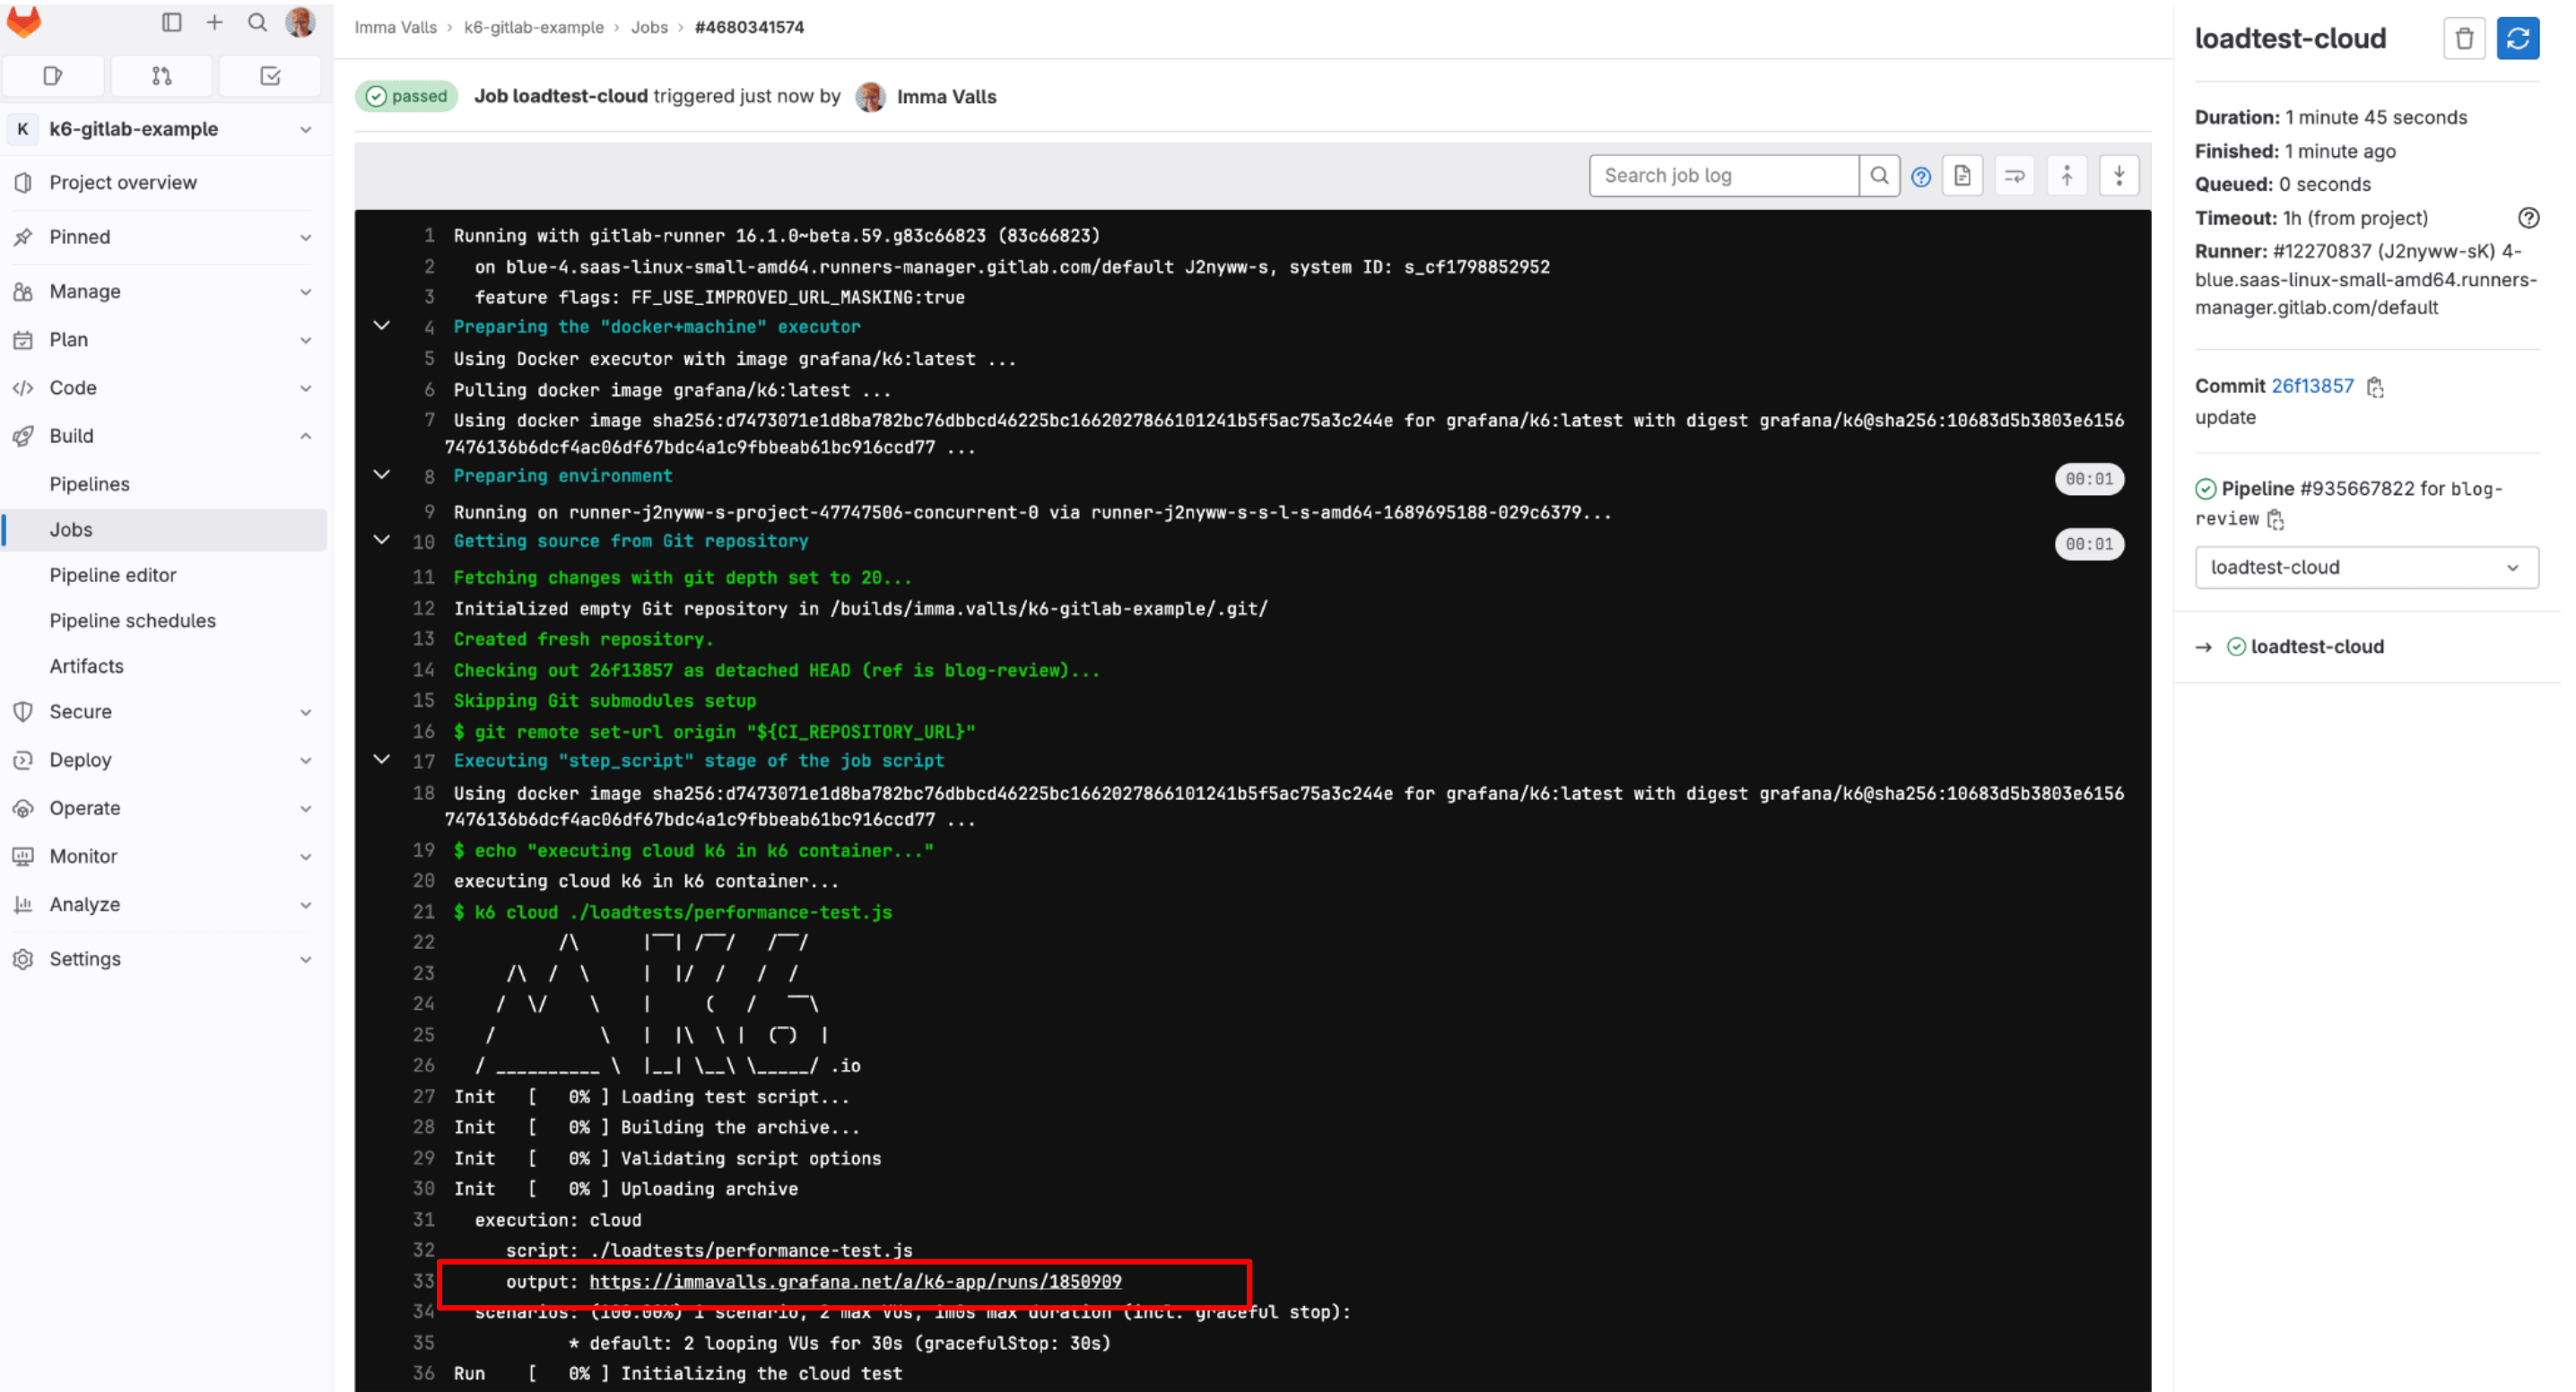
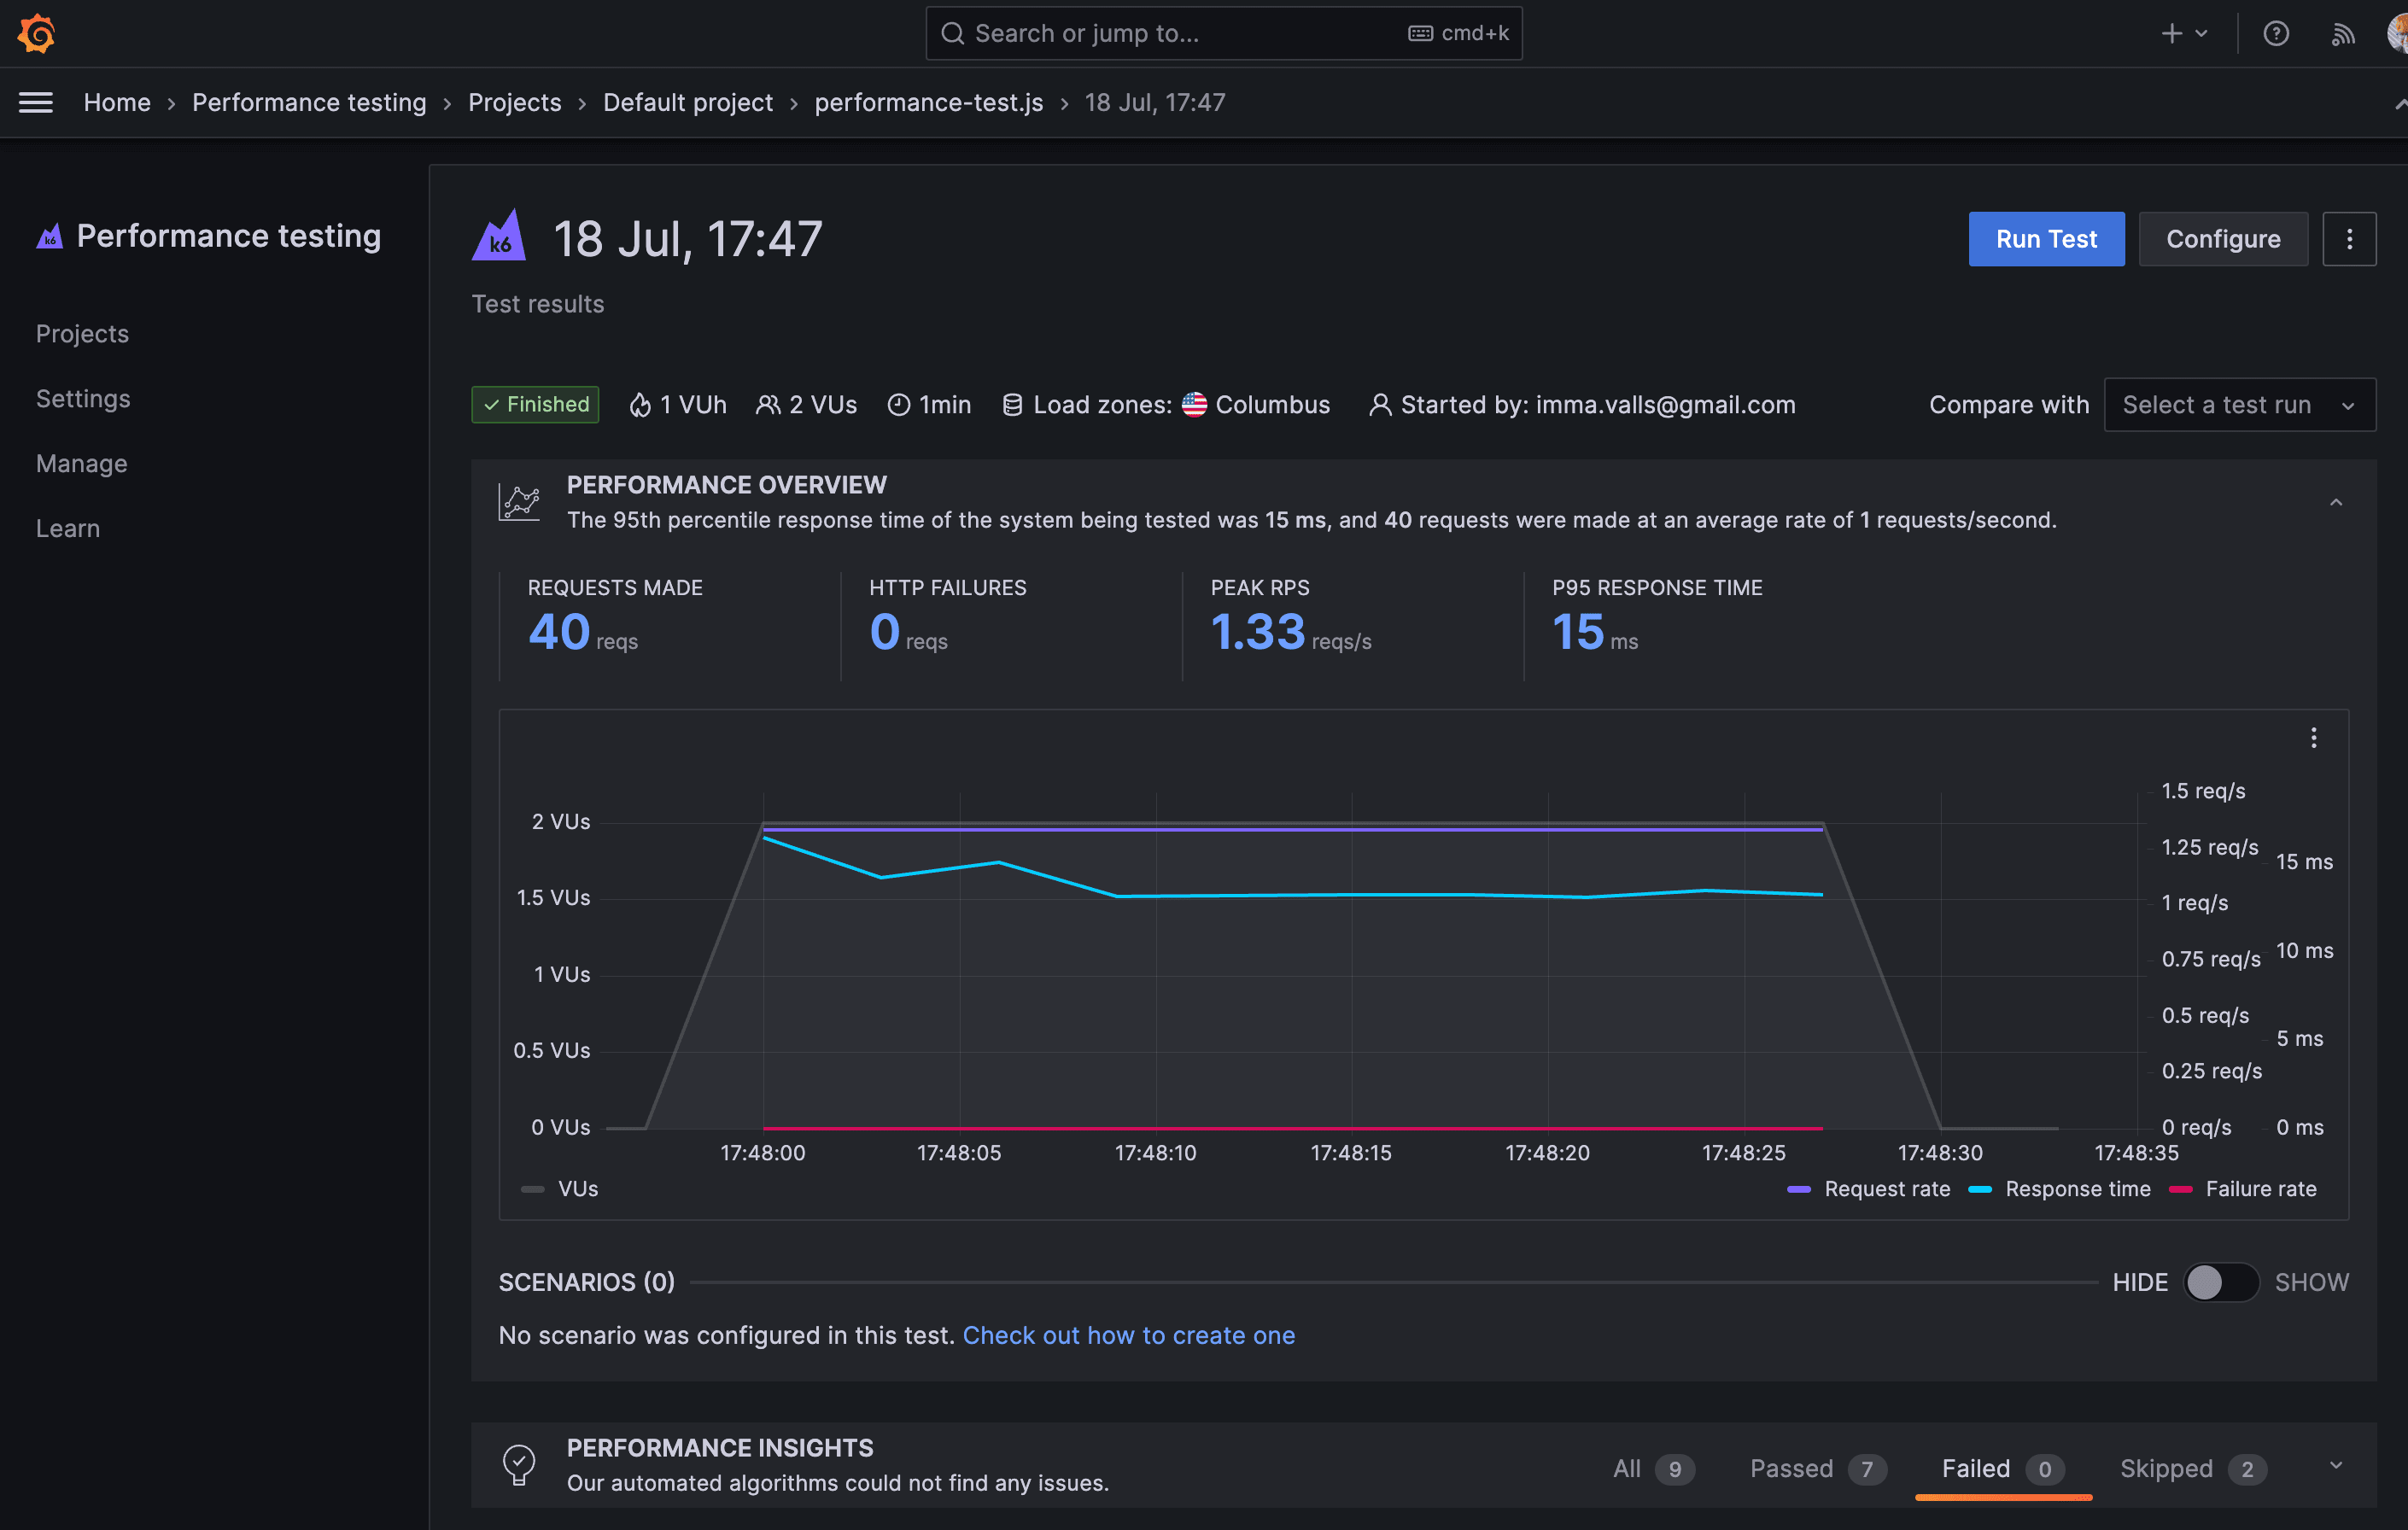
It is essential to know that GitLab CI prints the output of the k6 command, and when running cloud tests, k6 prints the URL of the test result in Grafana Cloud k6. You could navigate to this URL to see the result of your cloud test.
Nightly triggers
It’s common to run some performance tests during the night when users do not access the system under test. For example, this can be helpful to isolate larger tests from other types of tests or to generate a performance report periodically.
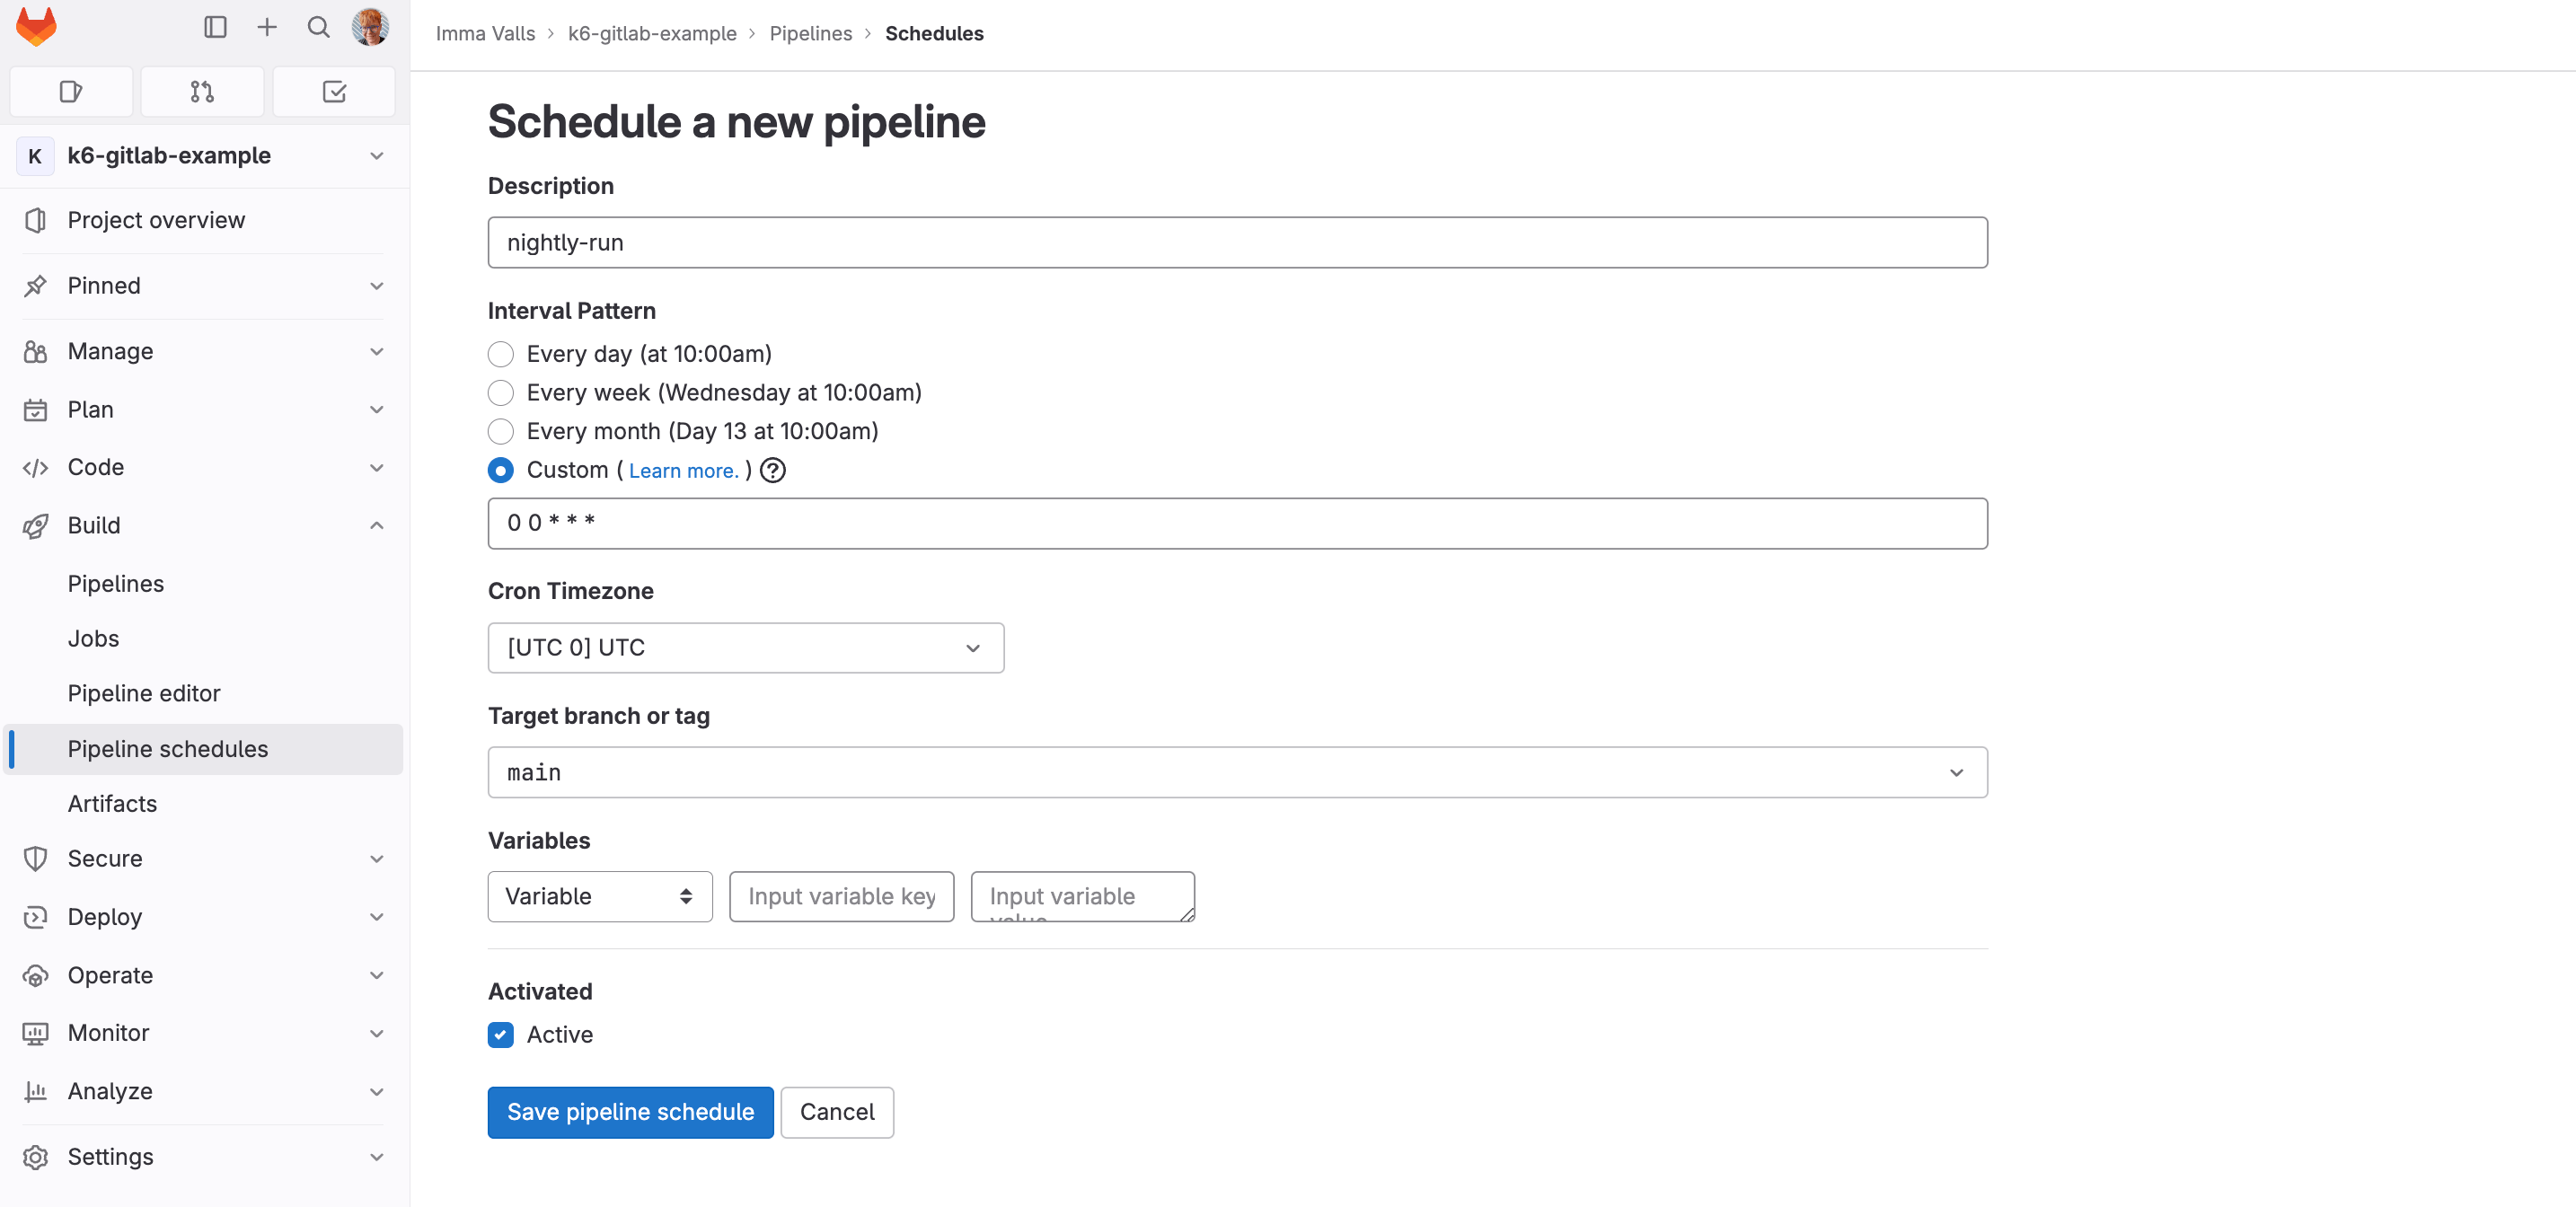
To configure scheduled nightly build that runs at a given time of a given day or night, follow these steps:
- Head over to
Build -> Pipelineschedules section of your repository. - Click New schedule and configure it.
- Fill in a cron-like value for the time you wish to trigger the job execution at.
- Click on
Save pipeline schedule.
For example, to trigger a build at midnight everyday, the cron value of 0 0 * * * will do the job. The screenshot below shows the same. For this example, it is in UTC.
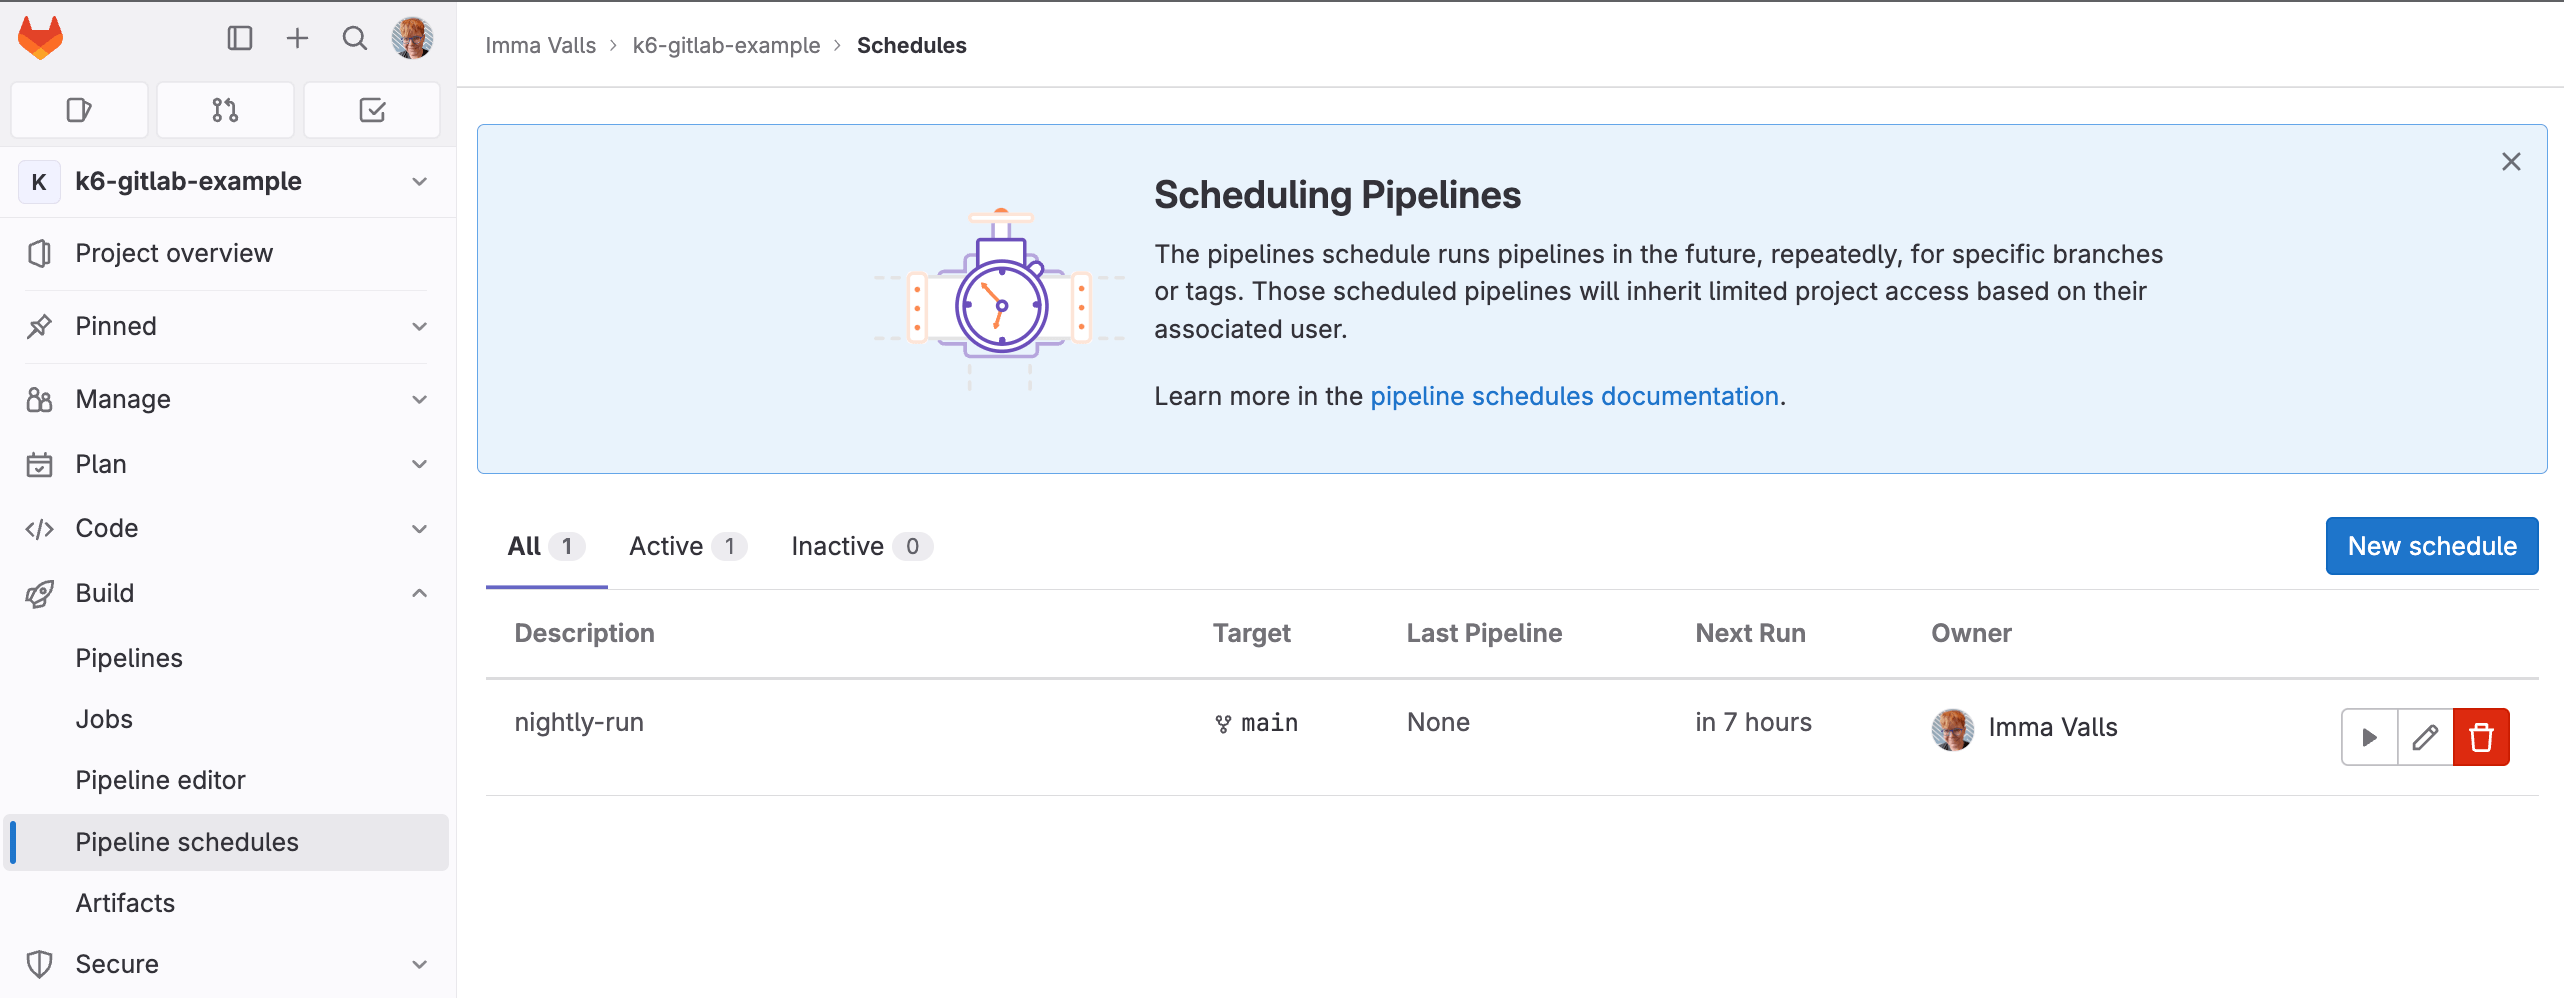
This is your saved job schedule. You can test it by clicking on the ▶️ button.
To learn more about GitLab pipeline schedules, we recommend reading the pipeline schedules documentation.
Hope you enjoyed reading this post. We’d be happy to hear your feedback.
Grafana Cloud is the easiest way to get started with Grafana k6 and performance testing. We have a generous forever-free tier and plans for every use case. Sign up for free now!


