How I'm using Grafana and Prometheus to monitor my 3D printing
My name is Jonathan Stines, and I am a Penetration Tester for Rapid7, a cybersecurity company located in Austin, Texas. A small handful of my former colleagues at Rapid7 now work at Grafana Labs and have said it was a pretty cool spot to have landed. I had a vague understanding of what Grafana was, but what really struck my interest was when I saw their sweet dashboards in the HBO series Silicon Valley. Gilfoyle had his dashboards set up to monitor Pied Piper’s hardware along with active users.
A chronic tinkerer, bored and stuck quarantining at home because of the coronavirus, I found the perfect concoction of inspiration I needed to try to simulate that setup. Additionally, I have recently taken up 3D printing as a hobby and found an immediate use for Grafana with monitoring my prints. So down the rabbit hole I went!
I learned that through OctoPrint (3D-printing middleware) plugins, you could automatically export data via Postgres, InfluxDB, and Prometheus – all data source formats supported by Grafana. After spending a couple hours setting up the databases, I found that I got everything speaking with Grafana! “So what now….?!” I thought…
After reviewing all the data, I realized that not only was I able to easily produce slick-looking monitoring dashboards that I could impress my buddies with, but I could also use it to help calculate the cost of each print! Additionally, it could help me track the amount of filament I have left in each of the colors. Here is an example of a desktop dashboard I set up to facilitate all this:
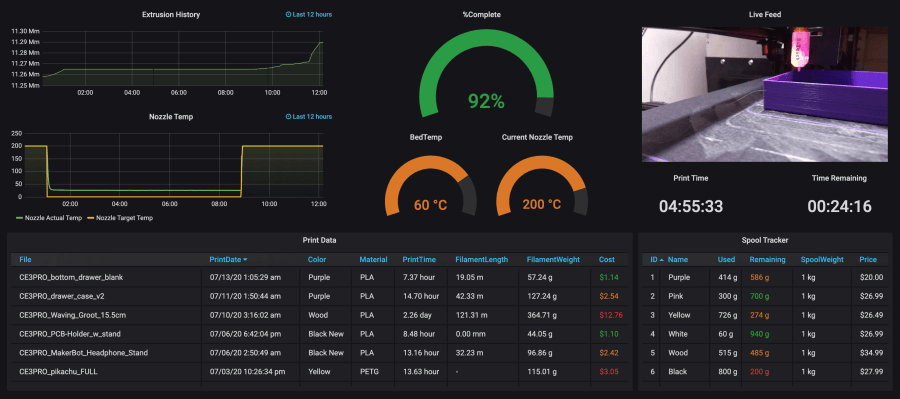
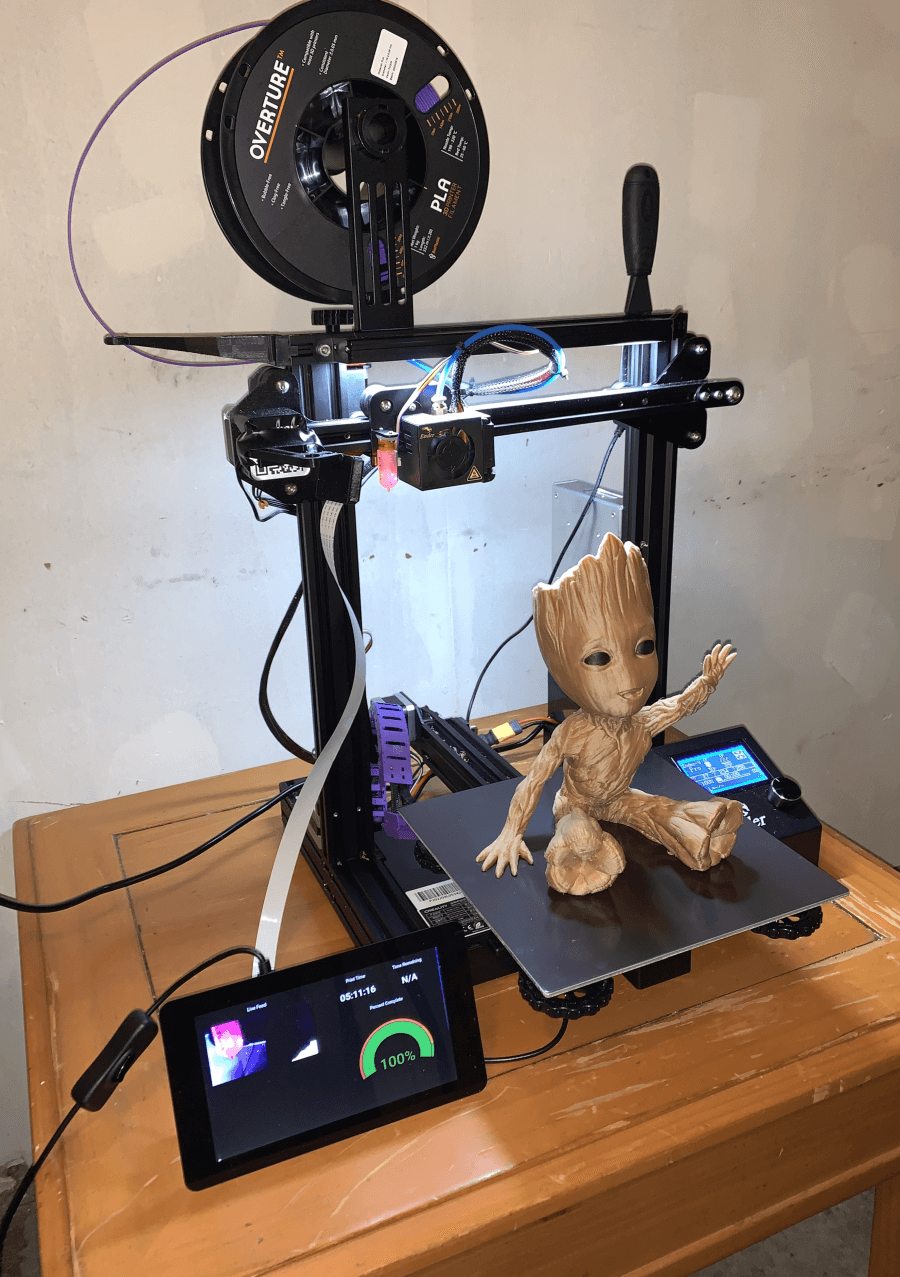
I wound up buying a 7” Raspberry Pi touchscreen, which sits next to the printer. I created another dashboard that allowed for a quick glimpse in kiosk mode at the current job’s status along with a table of previous prints, length of time each took to print, and the cost of the print. Here is the printer setup (pardon the cable mess – cable management was never my strong suit):
Here are some of the online resources I used to produce my dashboards. Shoutout to the authors of these posts – I probably wouldn’t have been able to get my dashboards to where they are now without their guidance!
Article about a nifty OctoPrint plugin to export data to Prometheus
Very in-depth article about exporting data over MQTT via Node Red and importing to Grafana’s InfluxDB. Also touches on creating dashboards to calculate the price per print.
As far as setting up OctoPrint, I followed the guide from the Raspberry Pi website to get everything up and running.
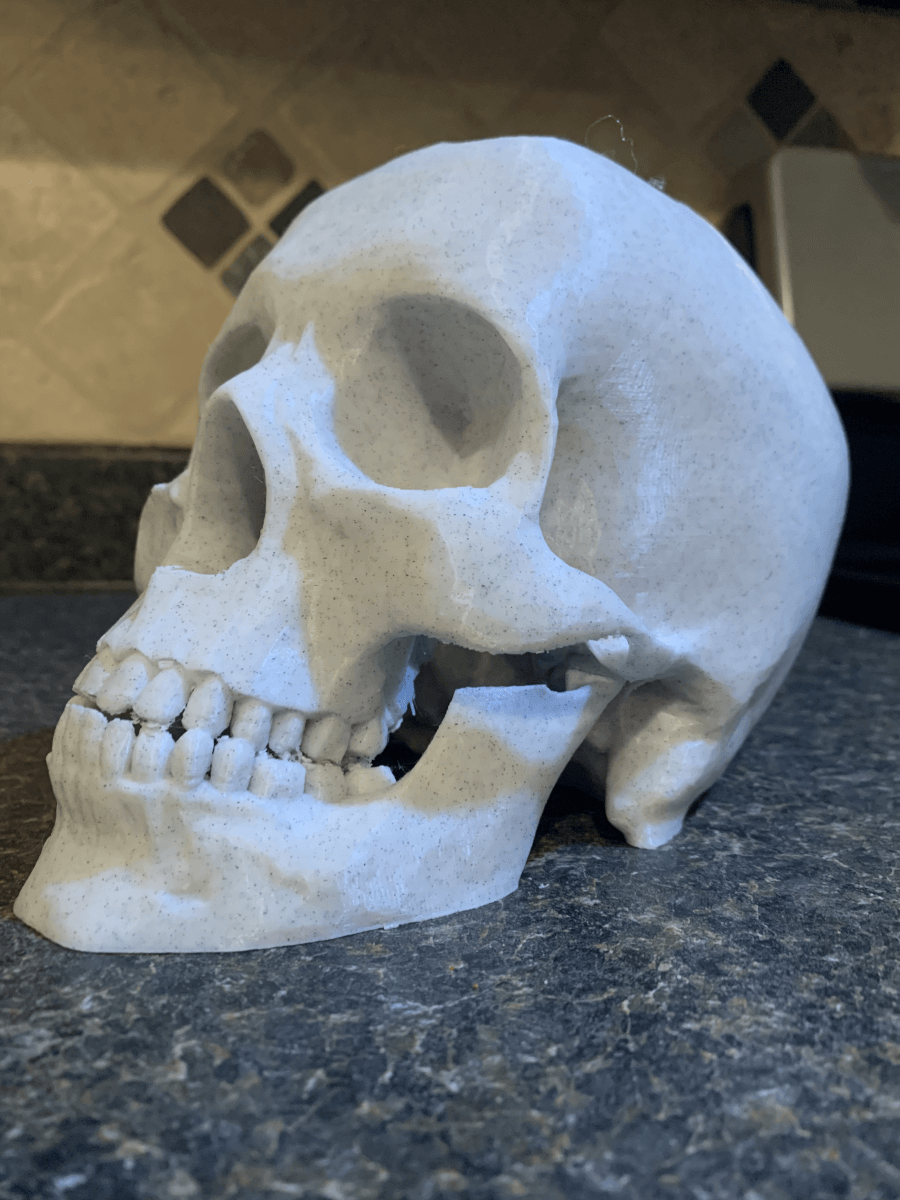
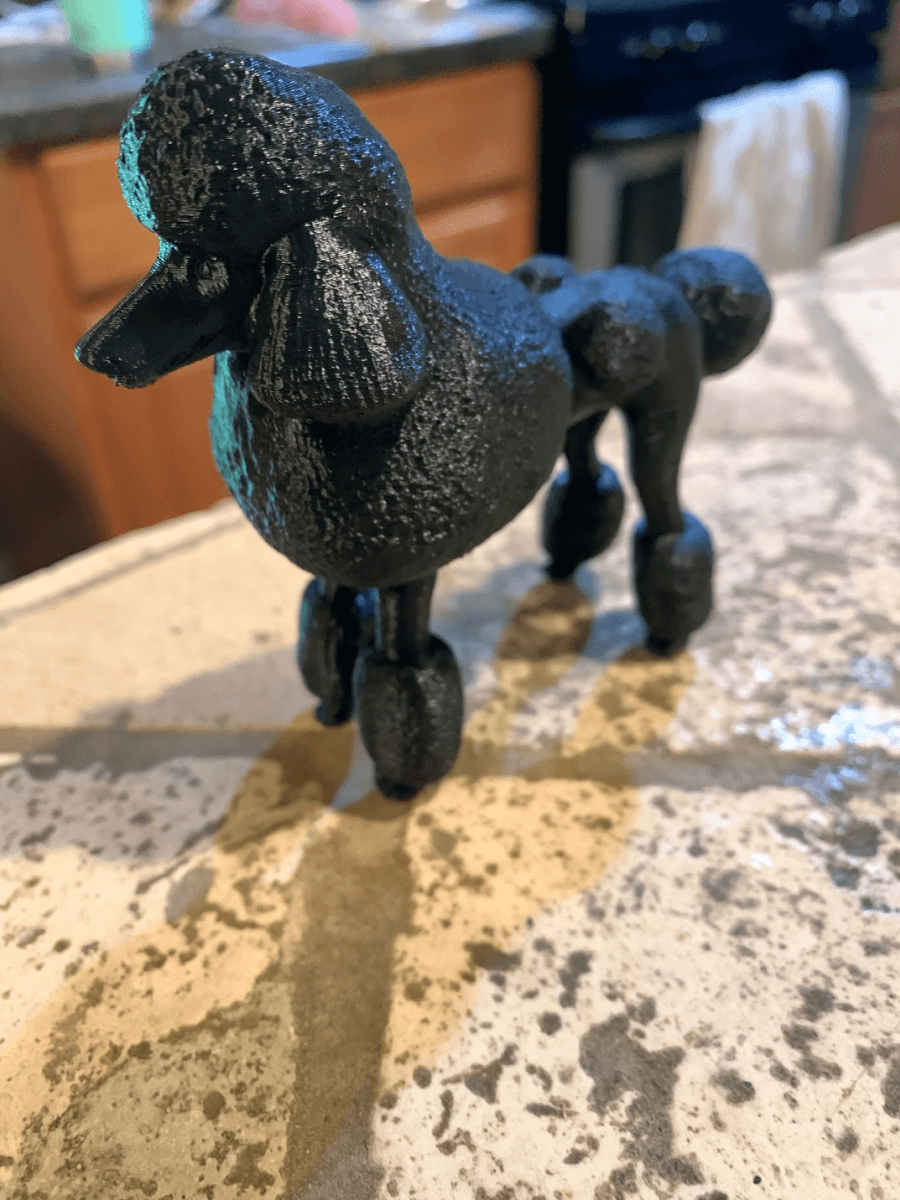
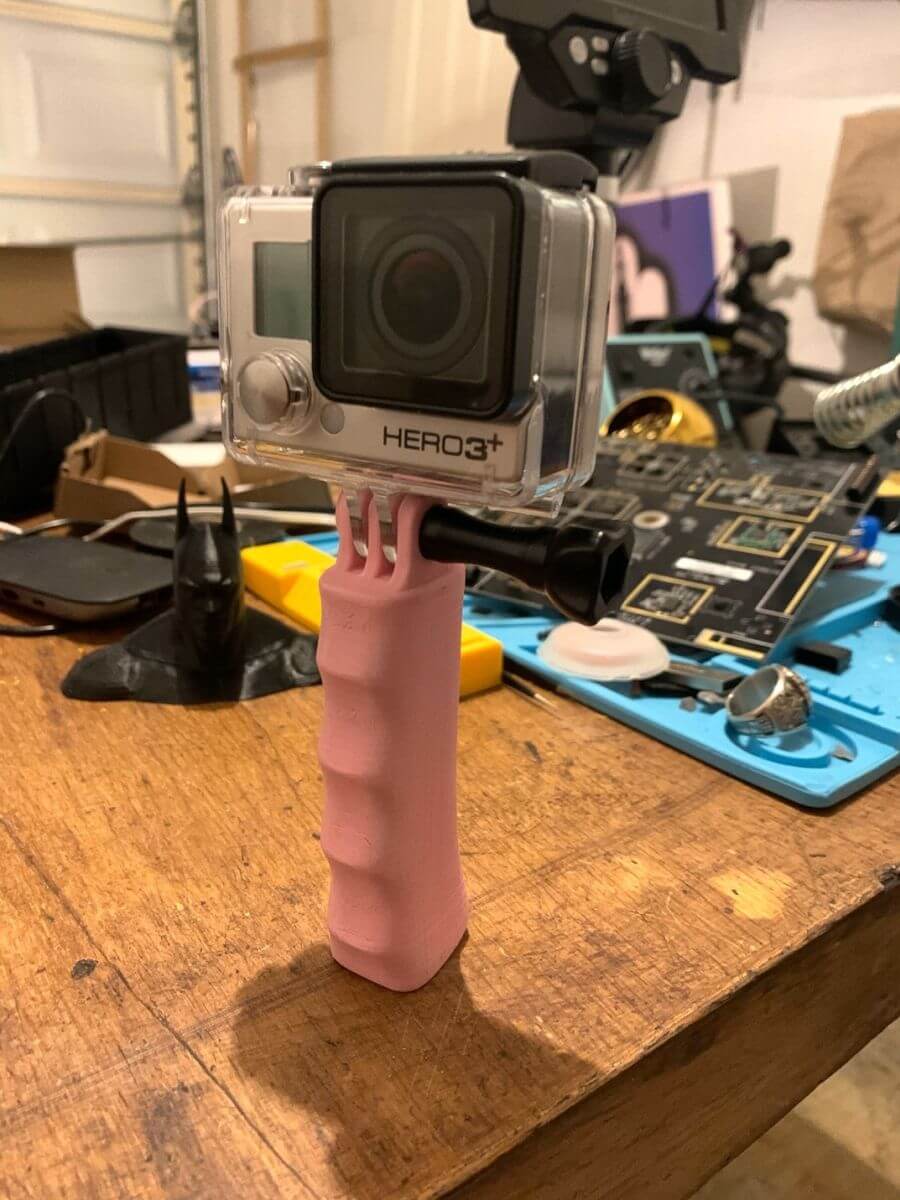
All in all, I will continue to use Grafana in my home automation efforts. I also leverage Home Assistant to help with automated tasks, and that along with VMware ESXi integration will be my next goals for my Grafana efforts. In the meantime, here are some of my 3D prints for your viewing pleasure. : )
