September observability roundup: Run Prometheus-as-a-Service with the new Grafana Metrics Enterprise, ObservabilityCON, and more
New from Grafana Labs
Grafana Metrics Enterprise
What is it?
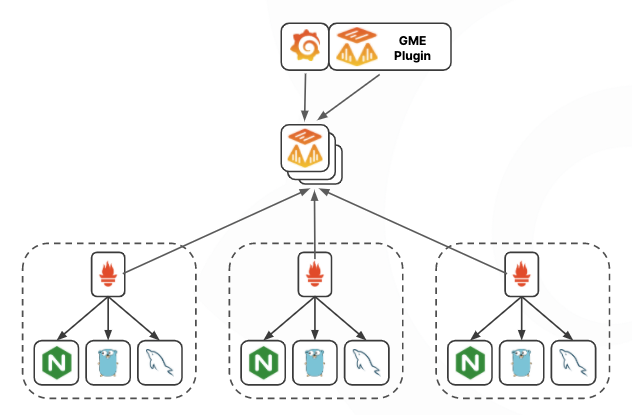
→ Our latest product offering, Grafana Metrics Enterprise (Ed. note: now called Grafana Enterprise Metrics. Built on Cortex, GME is a simple and scalable solution that enables Prometheus-as-a-Service for large organizations running at scale.

What makes it awesome?
It’s the first of its kind: a Prometheus-as-a-Service solution designed for large companies that provides some key features for any organization attempting to scale out its current Prometheus installation.
Where to learn more?
Check out the blog post on the solutions that GME provides for organizations that want to scale out their Prometheus installation.
You can also reach out us directly to learn more.
Prometheus-style alerting for Grafana Cloud
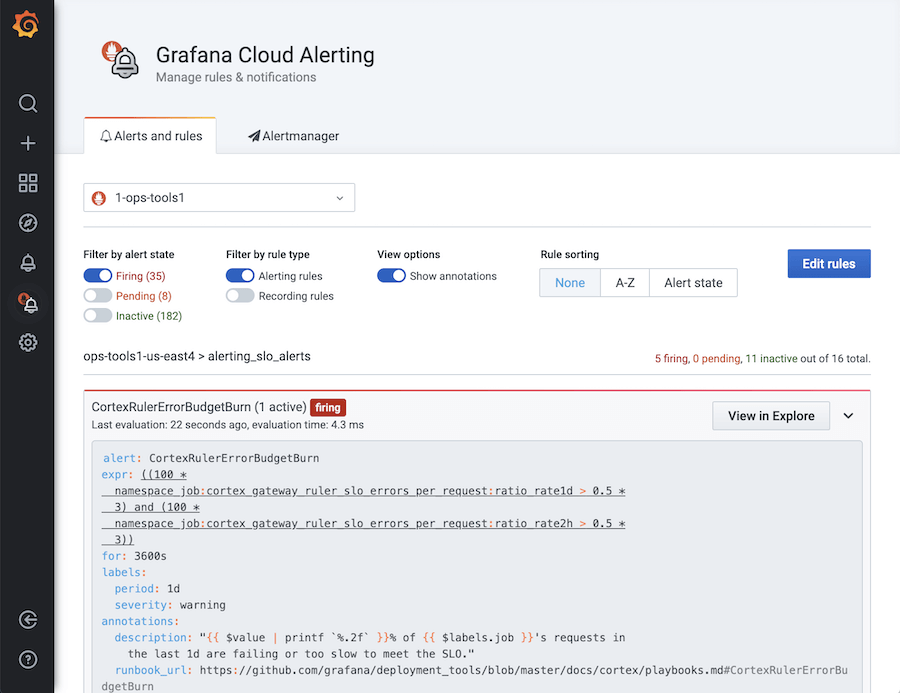
There’s an exciting update rolling out over the next few weeks that will make alerting with Grafana Cloud so much more enjoyable.

What makes it awesome?
It’s dead simple and super effective. There’s a brand-new icon in the side navigation: Grafana Cloud Alerting. So as soon as you’re up and running with Grafana Cloud, all the power of Prometheus-style alerting and recording rules are right at your fingertips: no additional tooling, no downloads, and no command line foo necessary. You’ll be able to view all of your rules in one place; it’s pretty familiar if you’ve interacted with these kinds of alerts before. Even better, you’ll also be able to create, update, and delete all of these rules from this same page without ever having to touch a single configuration file (though you still can if you want to!), so you don’t ever have to worry about switching context. You’ll even be able to update your Alertmanager configurations from here, too. It’s that simple.
Where to learn more?
Read all about the new Prometheus-style alerting for Grafana Cloud on the blog and sign up for your free trial now!
A new plugin for GitHub
What is it?
This is the first release of the GitHub data source. The source code is available at github.com/grafana/github-datasource. Using the GitHub data source, Grafana users can visualize data from GitHub’s API.

What makes it awesome?
With this new open-source plugin, you can do things like:
- Annotate events like releases, commits, issues, and pull requests.
- Display tabular GitHub data.
- Use dashboard variables to monitor different datasets using the same panels, or create repeating panels using multi-value variables.
Where to learn more?
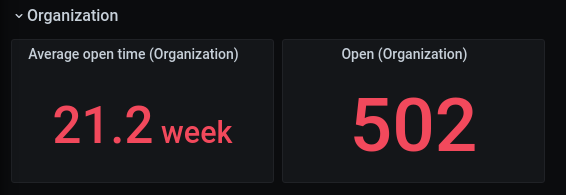
Read about how we use the Grafana GitHub plugin to track outstanding pull requests in our recent blog post.
The latest version of the Dynatrace plugin
What is it?
We’ve made some useful improvements to our Enterprise Dynatrace plugin so you can you can easily create user-friendly, exec-ready dashboards from your Metrics API v2 data and custom metrics.

What makes it awesome?
- This new update makes it easy to configure and get started monitoring Dynatrace.
- It’s now really easy to compose a query.
- You now have ability to alias your metric names so they are much easier to understand for your viewers.
- You can use Grafana features such as transformations and a variety of built-in panel types such as our beloved stat panel and the ever-popular gauge panel.
Where to learn more?
Check out this blog post to see all of the details.
Trending this month
Torkel talks with Craig Box, Adam Glick on the Kubernetes Podcast
Our co-founder (and creator and project lead of Grafana) Torkel Ödegaard was featured on the Kubernetes Podcast. Listen to Torkel talk with Craig Box and Adam Glick about how he went from modding video games to building a data visualization platform, and co-founding a company that is now offering a complete monitoring service built on Prometheus.
The latest on Loki
Owen Diehl, one of the Loki maintainers on our team, wrote about the often overlooked organizational benefits of the Loki logging system, including reducing costs, streamlining operations, and building better teams. If you want to reduce your operational overhead even more, sign up for a free trial of Grafana Cloud.
Events and community
Get a first look at GME

We’ll be hosting a live webinar on this release, presented by Tom Wilkie — VP of Product at Grafana Labs, Prometheus maintainer, and Cortex co-creator — and Engineering Director Matt Mendick where you can learn about GME’s:
- Centralized, horizontally scalable, replicated architecture
- Centralized access control and authentication
- Simple deployment and maintenance of your complete set of metrics in a cost-effective way
- Support, training, and consulting by our team, including maintainers of Prometheus and Cortex
Register for the webinar here.
Grafana ObservabilityCON

Don’t miss out on live technical talks, demos, Q&As, and deep dives into Grafana, Prometheus, Loki, and everything else you love in the open source observability ecosystem! Grafana ObservabilityCON is live, free, and virtual October 26-29. And if you’ve got a great observability story you’d like to share, don’t wait – our CFP is closing today! Register for free or submit your talk ideas here.
New community plugin

The slick new community-built Service Dependency Graph Panel plugin allows you to monitor a service’s latencies, errors, and requests. Learn more here.
CNCF observability survey

The end users have spoken! A Cloud Native Computing Foundation survey on observability found that the two most recommended technologies were Prometheus and Grafana, and two-thirds of the companies that responded are using them together. Read the blog.


