Introducing Grafana Metrics Enterprise, a Prometheus-as-a-service solution for enterprise scale
Today, we announced the launch of a new Grafana Labs product: Grafana Metrics Enterprise (Ed. note: now called Grafana Enterprise Metrics), a scalable Prometheus-compatible service designed for large organizations that is seamless to use and simple to maintain.
Over the past few years, Prometheus has risen in popularity to become the de facto monitoring system for the cloud native ecosystem around Kubernetes — and for good reason. It has a simple yet powerful data model and a query language that lets you analyze how your applications and infrastructure are performing.
Running Prometheus in larger enterprises is more complicated. They have to deal with issues of the scale, the impedance mismatch between Prometheus’s pull-based architecture and their network topology, and security requirements.
Challenges using Prometheus at scale
While there are clear advantages to using Prometheus in complex, distributed environments like Kubernetes, there are also well-documented challenges to adopting the technology at the enterprise level:
- Prometheus’s single-process model requires you to functionally shard your deployment to handle growth; this adds management overhead and complexity.
- Prometheus’s high availability model relies on pairs of Prometheus servers scraping the same targets. When a server fails, or needs to be restarted to apply updates, there are gaps in your graphs.
- Prometheus has no access control or multi-tenancy features. These have to be layered on using custom software or achieved by giving different teams different Prometheus instances.
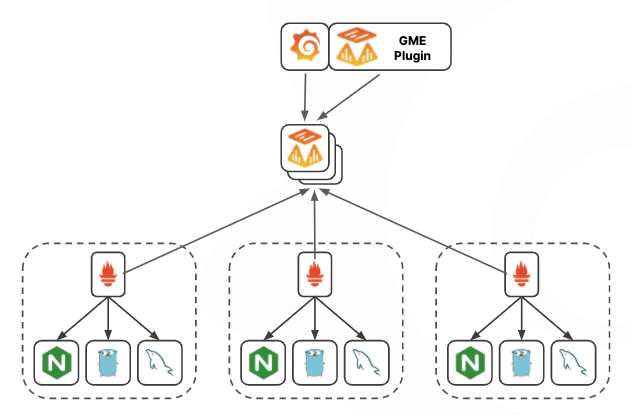
- Prometheus is designed to be deployed near the services it is scraping, utilizing service discovery to find targets. But to centralize metrics from many clusters across many data centers, the pull model is difficult to manage with firewalls and networks designed to prevent this behavior.
To help solve these problems, Cortex, a CNCF incubating project, was designed to be a scalable, highly available “clustered” Prometheus implementation. Our team has been deeply involved in the Cortex project, and today Grafana Labs employs five of the eight Cortex maintainers.
It was the experience working on this project that formed the foundation for Grafana Metrics Enterprise.
Introducing Grafana Metrics Enterprise
Grafana Metrics Enterprise is the simple-to-install-and-configure, secure, batteries-included solution for a unified view into Prometheus metrics, for both real-time and historical analysis. Grafana Metrics Enterprise provides all the benefits of the Cortex OSS project, but with features that enterprises value, such as built-in instance management and authentication to provision and control access. The solution will provide usage insights to dig down deep into usage patterns to find value or areas for improvement, and fine-grained access control, permitting some users to view only the data they should have access to, and others to view the entire dataset.
Grafana Metrics Enterprise was built on the Cortex project, and extends those capabilities to provide customers with a centralized, horizontally scalable, replicated architecture so they can easily manage and maintain their Prometheus implementation based on their specific architecture.
It’s the first of its kind: a Prometheus-as-a-Service solution designed for large companies that provides some key features for any organization attempting to scale out its current Prometheus installation.
Easy configuration
Getting started with Grafana Metrics Enterprise is really easy. Out of the box, it gives organizations a fully assembled and configured monitoring stack, so there’s no need to build systems from open source components. Grafana Metrics Enterprise only has one binary to deploy and scale, which limits the overall complexity of the system while still allowing for horizontal scalability and minimal dependencies: Organizations only need to provide S3-compatible storage.
Simplified scaling
Grafana Metrics Enterprise simplifies and automates the scaling and long-term storage of Prometheus metrics. With Grafana Metrics Enterprise, users can easily store application and infrastructure metrics in one centralized cluster (and soon, across multiple clusters) without needing a dedicated team.
Prometheus’s pull-based architecture can be hard to adopt in enterprise environments, and is often incompatible with their network topology and firewall rules. Grafana Metrics Enterprise brings the benefits of Prometheus to enterprises in a way that is more sympathetic to their architectural requirements.

Instance management
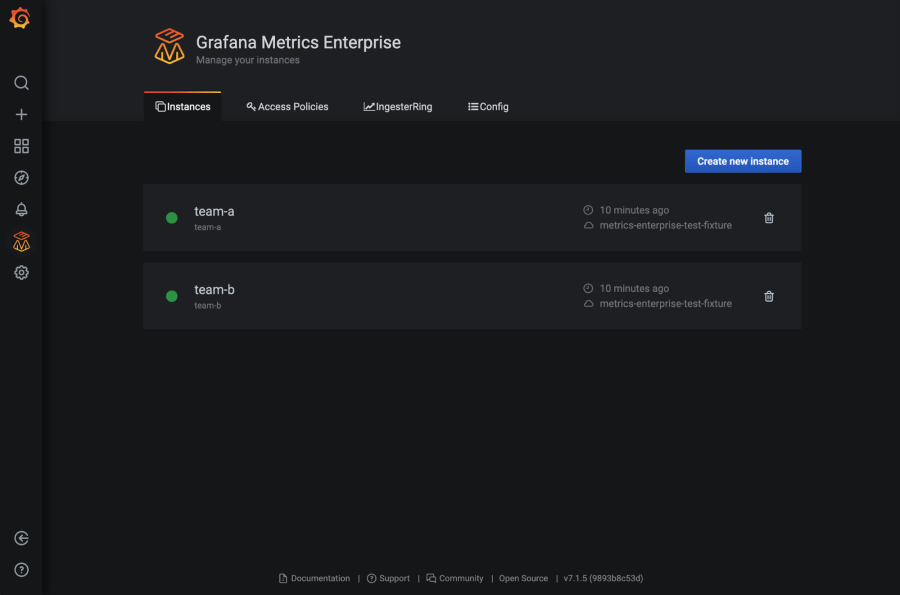
Instance management gives users the ability to create and manage instances, access policies, and tokens so they can easily scale from one to hundreds of metrics instances on a single Metrics Enterprise cluster. Each instance provides an isolated logical separation of the cluster, resulting in more secure access and ensuring the right teams have the right visibility.
Operators using Grafana Metrics Enterprise will have full control over the instances running on their cluster, by either using the built-in API directly or the official Grafana Labs Metrics Enterprise plugin.

Access control
With enterprise-grade access control, Grafana Metrics Enterprise enables users to go beyond read and write permissions with fine-grained access control within and across instances. For example, some customers want to control data ingestion per tenant, but allow global read access.
There are also more robust data-access policies, which enable administrators to secure and govern data. This allows multiple teams to securely share the same cluster with full isolation.
Alternatively, using centralized authentication will allow administrators to go tokenless and utilize OpenID Connect authentication to pair enterprise authentication with access policies, integrating with a current authentication provider.
Support
With Grafana Metrics Enterprise, teams get support, training, and consulting provided by the Grafana Labs team, including maintainers of Prometheus and Cortex. We’ll help with anything organizations need to implement Prometheus and Grafana Metrics Enterprise.
Commitment to open source
Grafana Metrics Enterprise is 100% compatible with the feature set that open source Cortex already provides. It builds on what is available in Cortex, adding features tailored specifically for enterprises that complement, and in no way detract from, the open source project. The Grafana Labs team is committed to improving and adding new features to upstream Cortex, and will continue to make deep contributions to the open source project.
Learn more about Grafana Metrics Enterprise
Tom Wilkie (Grafana Labs VP Product, Prometheus maintainer, and Cortex co-creator) and I took a deeper dive into Grafana Metrics Enterprise during a one-hour webinar, which you can watch on demand here.
You can check out the docs for Grafana Metrics Enterprise here, and contact us if you’d like to try it out!


