Introducing Prometheus-style alerting for Grafana Cloud
Hi! My name’s Richard Lam, and I’m the new product manager for Grafana Cloud. I’m really excited for my first contribution to this community, both so I can introduce myself to you all, and so I can highlight an awesome new Grafana Cloud feature that’s coming your way! Happy reading, and hopefully this is just the start of many more communications from me.
Prometheus alerting today
When you want to add Prometheus-alerts to Grafana Cloud today, it requires a bit of work and magic. You’d have to either set up and interact with your own local Prometheus, or download and install the additional cortextool in order to send alerts to us. Both of these solutions work, but neither of them are close to ideal. And even though there is an Alertmanager UI already available in Grafana Cloud to view and silence active alerts, it’s sadly not accessible until you’ve actually configured your first alert! But we’re changing all of that, and alerting with Grafana Cloud is going to become so much more enjoyable.
What’s new
Centralized alerting is one of the most requested features from our Grafana Cloud users. In many organizations, the people building the alerts are not the same people who are modifying the local filesystem on the Prometheus server, so it becomes increasingly important to not have multiple alerts that live in isolated, disparate places and are hard to read and understand. Recently, we published documentation for an early-access preview into how to get started using cortextool to jumpstart Grafana Cloud centralized alerting, and now, we’re ready to announce an exciting update that will be rolling out to our users over the next few weeks.

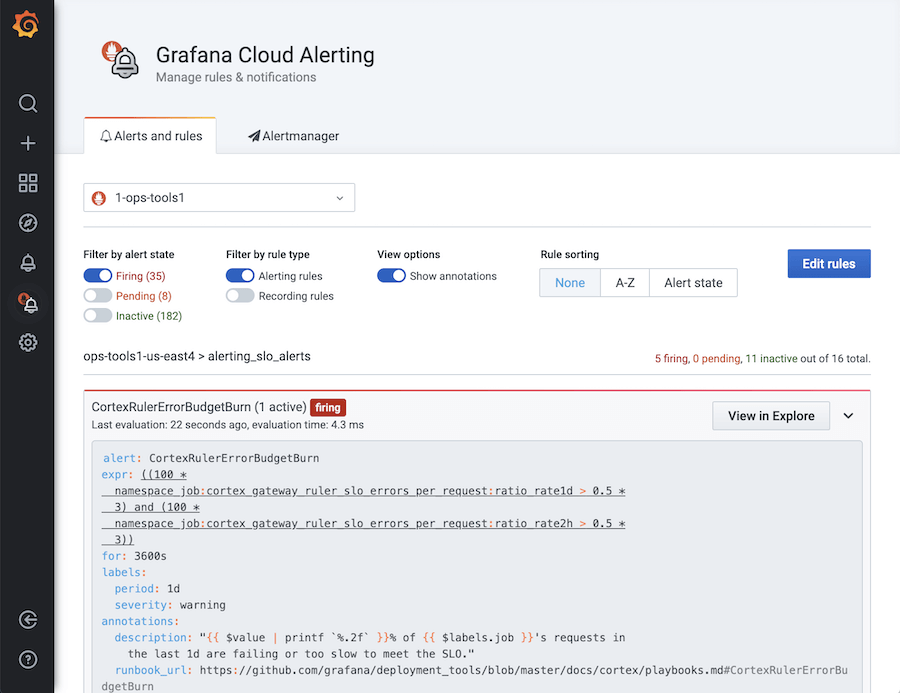
There’s a brand-new icon in the side navigation: Grafana Cloud Alerting. So as soon as you’re up and running with Grafana Cloud, all the power of Prometheus-style alerting and recording rules are right at your fingertips: no additional tooling, no downloads, and no command line foo necessary. You’ll be able to view all of your rules in one place; it’s pretty familiar if you’ve interacted with these kinds of alerts before. Even better, you’ll also be able to create, update, and delete all of these rules from this same page without ever having to touch a single configuration file (though you still can if you want to!), so you don’t ever have to worry about switching context. You’ll even be able to update your Alertmanager configurations from here, too. It’s that simple.
How it works
First, the Grafana panels alerts you know and love aren’t going anywhere. We’re just making it easier to manage Prometheus-style rules and giving you more ways to stay aware of how your systems are behaving.
Here’s how to add your first Prometheus-style rules in Grafana Cloud:
- In Grafana, select the new Grafana Cloud Alerting icon to land on the Alerts and rules tab.
- If you have multiple Prometheus data sources, a dropdown will be available for you to select the one you want to create alerting and recording rules for.
- Click the Edit rules button to enable editing on the page.
- Click the Add rules button.
- Enter in your configuration details, using standard Prometheus configuration formatting. As an example:
alert: HighRequestLatency
expr: job:request_latency_seconds:mean5m{job="myjob"} > 0.5
for: 10m
labels:
  severity: page
annotations:
summary: High request latency- Click the Save button.
- Click the Finish editing button to leave editing mode.
- Your alert should now be viewable! Note that this might take up to a minute, as Prometheus looks for new rule updates in the background.
- Finally, select the Alertmanager tab to add your Alertmanager configuration for managing the rule’s notifications.
That’s it! For more in-depth information about how to use Grafana Cloud Alerting, please visit our product documentation.
Is this it?
No! This is just the first step. We know there’s so much more we could do to make this better. Trust us when we say we’re not finished, but we want to launch early and iterate often. So even though this isn’t close to the final product, we still think it’ll dramatically improve your experience.
For example, something that’s missing from this first public release is the ability to silence alerts. For now, you can continue to do this in the Alertmanager interface, but rest assured, it’ll come soon to Grafana Cloud Alerting – so stay tuned!
Finally, as the new product manager for Grafana Cloud, I’m excited for everyone to get their hands on this feature, and I’m even more excited to hear your feedback. If you’re not already using Grafana Cloud, sign up for a free trial today to give it a spin! I’d love to hear all the ways this will make your day-to-day easier, and more importantly, I want to know how we can continue to make this and our overall product even better.
Happy alerting everyone!
Firing,
Richard


