

Load testing with Jenkins
In this tutorial, we will look into how to integrate performance testing with k6 into your Jenkins Pipeline setup. By integrating performance tests into your CI pipelines, you can catch performance issues earlier and ship more stable and performant applications to production.
Prerequisites
- k6, an open source load testing tool for testing the performance of APIs, microservices, and websites.
- Jenkins, an open-source extensible automation server for Continuous Integration and Continuous Delivery (CI/CD).
The examples in this tutorial can be found here.
Write your performance test script
For the sake of this tutorial, we will create a simple k6 test for our demo API. Feel free to change this to any of the API endpoints you are looking to test.
The following test will run 50 VUs (virtual users) continuously for one minute. Throughout this duration, each VU will generate one request, sleep for three seconds, and then start over.
import { sleep } from 'k6';
import http from 'k6/http';

export const options = {
  duration: '1m',
  vus: 50,
};

export default function () {
  http.get('http://test.k6.io/contacts.php');
  sleep(3);
}
You can run the test locally using the following command. Just make sure to install k6 first.
$ k6 run performance-test.jsThis produces the following output:
          /\      |‾‾|  /‾‾/  /‾/
     /\  /  \     |  |_/  /  / /
    /  \/    \    |      |  /  ‾‾\
   /          \   |  |‾\  \ | (_) |
  / __________ \  |__|  \__\ \___/ .io

  execution: local
     script: performance-test.js
     output: -

  scenarios: (100.00%) 1 executors, 50 max VUs, 1m30s max duration (incl. graceful stop):
           * default: 50 looping VUs for 1m0s (gracefulStop: 30s)


running (1m02.5s), 00/50 VUs, 1000 complete and 0 interrupted iterations
default ✓ [======================================] 50 VUs  1m0s


    data_received..............: 711 kB 11 kB/s
    data_sent..................: 88 kB  1.4 kB/s
    http_req_blocked...........: avg=8.97ms   min=1.37µs   med=2.77µs   max=186.58ms p(90)=9.39µs   p(95)=8.85ms
    http_req_connecting........: avg=5.44ms   min=0s       med=0s       max=115.8ms  p(90)=0s       p(95)=5.16ms
    http_req_duration..........: avg=109.39ms min=100.73ms med=108.59ms max=148.3ms  p(90)=114.59ms p(95)=119.62ms
    http_req_receiving.........: avg=55.89µs  min=16.15µs  med=37.92µs  max=9.67ms   p(90)=80.07µs  p(95)=100.34µs
    http_req_sending...........: avg=15.69µs  min=4.94µs   med=10.05µs  max=109.1µs  p(90)=30.32µs  p(95)=45.83µs
    http_req_tls_handshaking...: avg=0s       min=0s       med=0s       max=0s       p(90)=0s       p(95)=0s
    http_req_waiting...........: avg=109.31ms min=100.69ms med=108.49ms max=148.22ms p(90)=114.54ms p(95)=119.56ms
    http_reqs..................: 1000   15.987698/s
    iteration_duration.........: avg=3.11s    min=3.1s     med=3.1s     max=3.3s     p(90)=3.12s    p(95)=3.15s
    iterations.................: 1000   15.987698/s
    vus........................: 50     min=50 max=50
    vus_max....................: 50     min=50 max=50
Configure thresholds
The next step is to add your service-level objectives (SLOs) for the performance of your application. SLOs are a vital aspect of ensuring the reliability of your systems and applications. If you do not currently have any defined SLAs or SLOs, now is a good time to start considering your requirements.
You can then configure your SLOs as pass/fail criteria in your test script using thresholds. k6 evaluates these thresholds during the test execution and informs you about its results.
If a threshold in your test fails, k6 will finish with a non-zero exit code, which communicates to the CI tool that the step failed.
Now, we add one threshold to our previous script to validate that the 95th percentile response time is below 500ms. After this change, the script will look like this:
import { sleep } from 'k6';
import http from 'k6/http';

export const options = {
  duration: '1m',
  vus: 50,
  thresholds: {
    http_req_duration: ['p(95)<500'], // 95 percent of response times must be below 500ms
  },
};

export default function () {
  http.get('http://test.k6.io/contacts.php');
  sleep(3);
}
Thresholds are a powerful feature providing a flexible API to define various types of pass/fail criteria in the same test run. For example:
- The 99th percentile response time must be below 700 ms.
- The 95th percentile response time must be below 400 ms.
- No more than 1% failed requests.
- The content of a response must be correct more than 95% of the time.
- Your condition for pass/fail criteria (SLOs)
Jenkins Pipeline configuration
There are three steps to configure Jenkins pipelines to fetch changes from your repository:
- Create a repository that contains a
Jenkinsfile, your k6 load test script and related files. - Create a new pipeline job on Jenkins to fetch changes from your repository.
- Add a webhook to GitHub to push changes to your Jenkins pipeline and trigger the performance test pipeline.
Setting up the repository
In the root of your project folder, create a file named Jenkinsfile. This configuration file will trigger the CI to build whenever a push to the remote repository is detected. If you want to know more about it, check out the tutorial: Using a Jenkinsfile.
Alongside the Jenkinsfile, we’ve added the script setup_k6.sh which installs k6 on the runner. For other ways to install k6, check out the k6 installation documentation.
#!/bin/bash
set -ex

sudo apt-get update
sudo apt-get install dirmngr --install-recommends
sudo apt-key adv --keyserver hkp://keyserver.ubuntu.com:80 --recv-keys C5AD17C747E3415A3642D57D77C6C491D6AC1D69
echo "deb https://dl.k6.io/deb stable main" | sudo tee /etc/apt/sources.list.d/k6.list
sudo apt-get update
sudo apt-get install k6
Then, we execute the script in the Jenkinsfile. Below is the Jenkins configuration that ties everything together.
pipeline {
agent any
stages {
stage('Performance Testing') {
steps {
echo 'Installing k6'
sh 'sudo chmod +x setup_k6.sh'
sh 'sudo ./setup_k6.sh'
echo 'Running K6 performance tests...'
sh 'k6 run loadtests/performance-test.js'
}
}
}
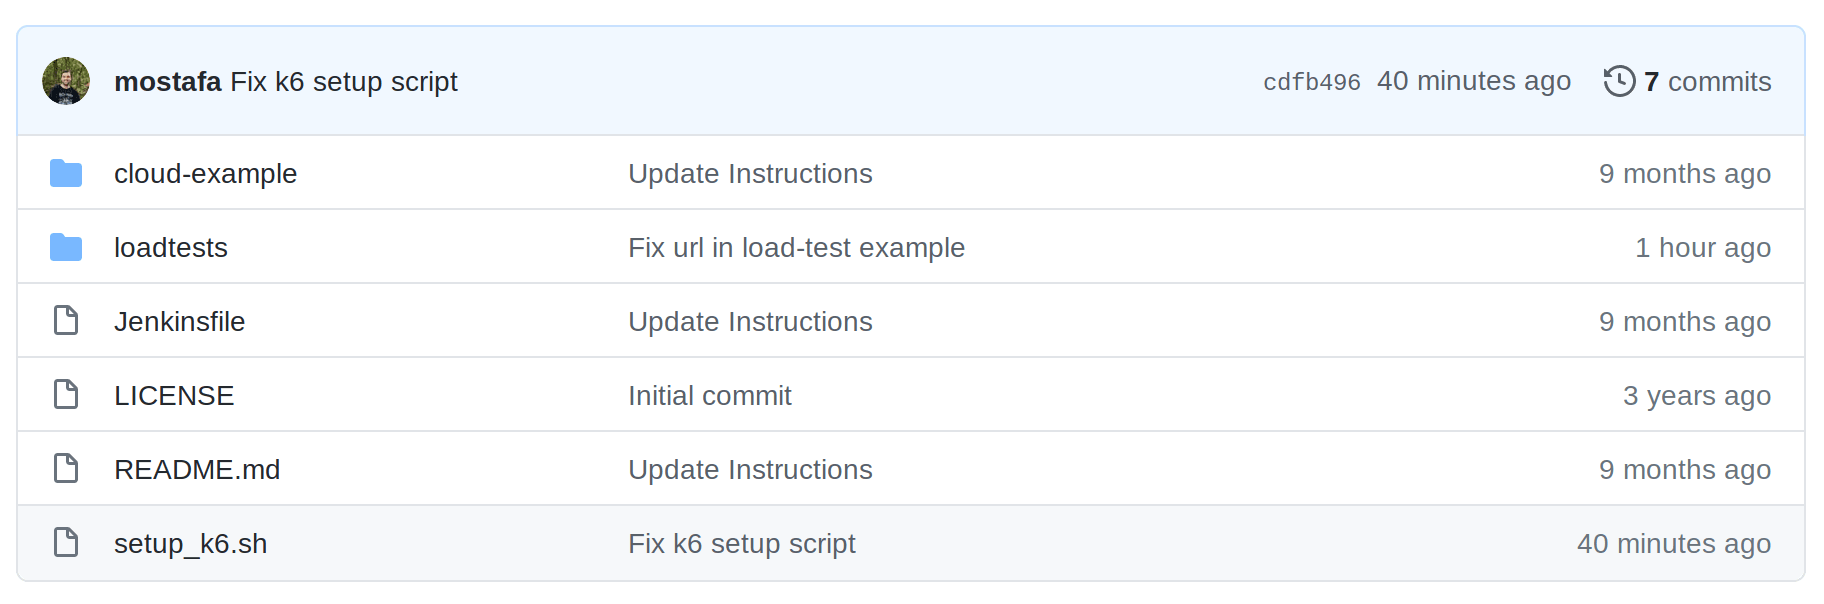
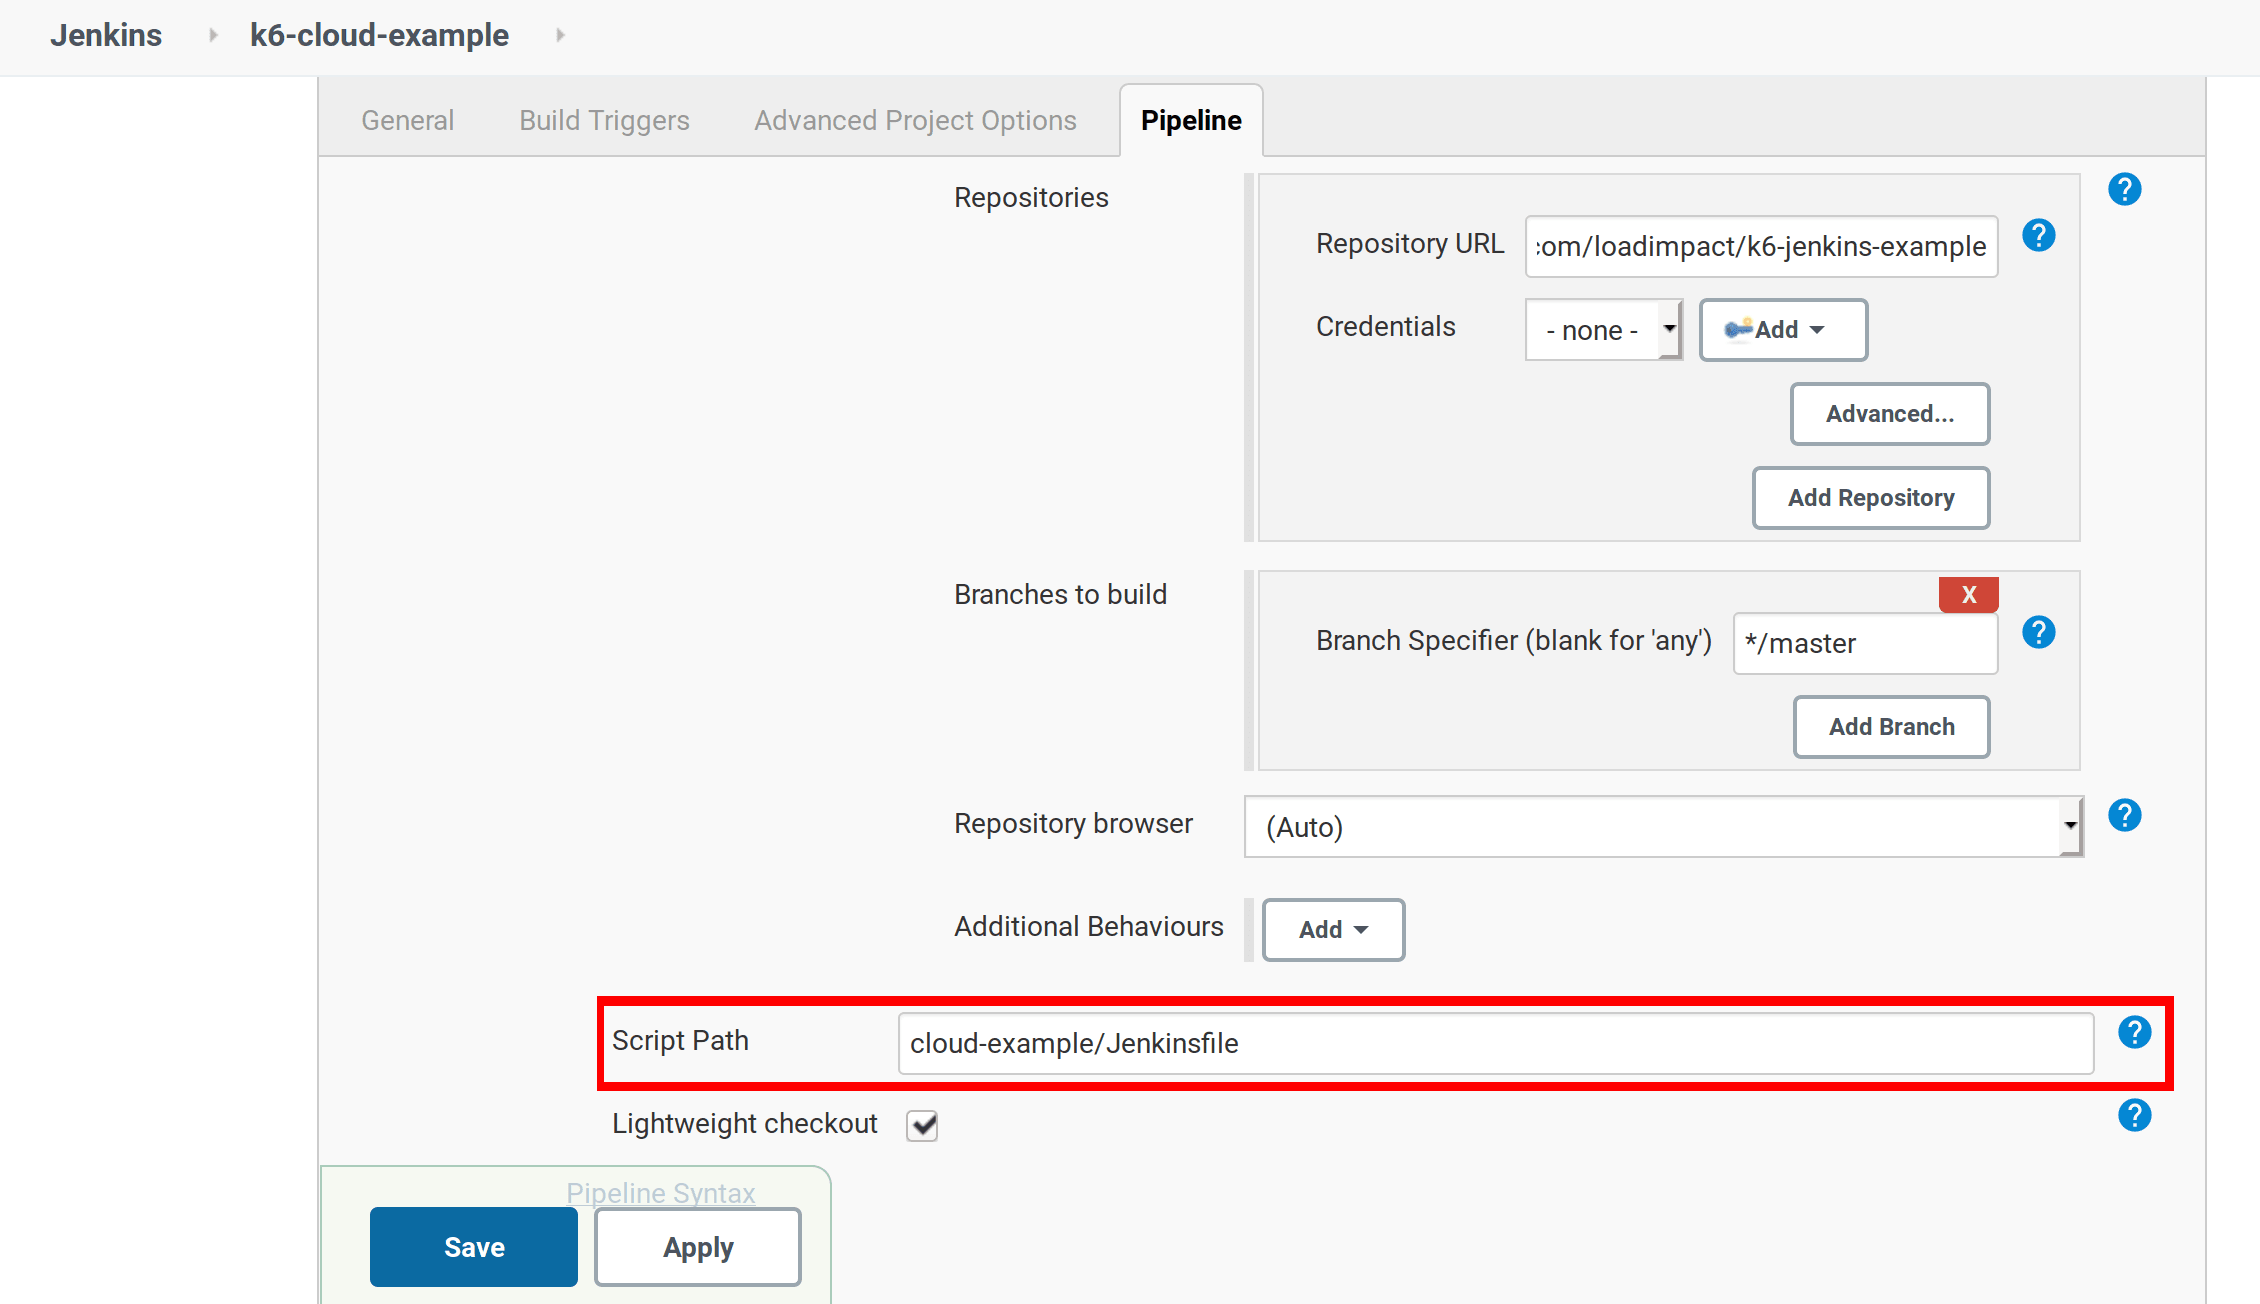
}Eventually, your repository should look like the following screenshot. You can also fork the k6-jenkins-example repository.
Creating the pipeline job
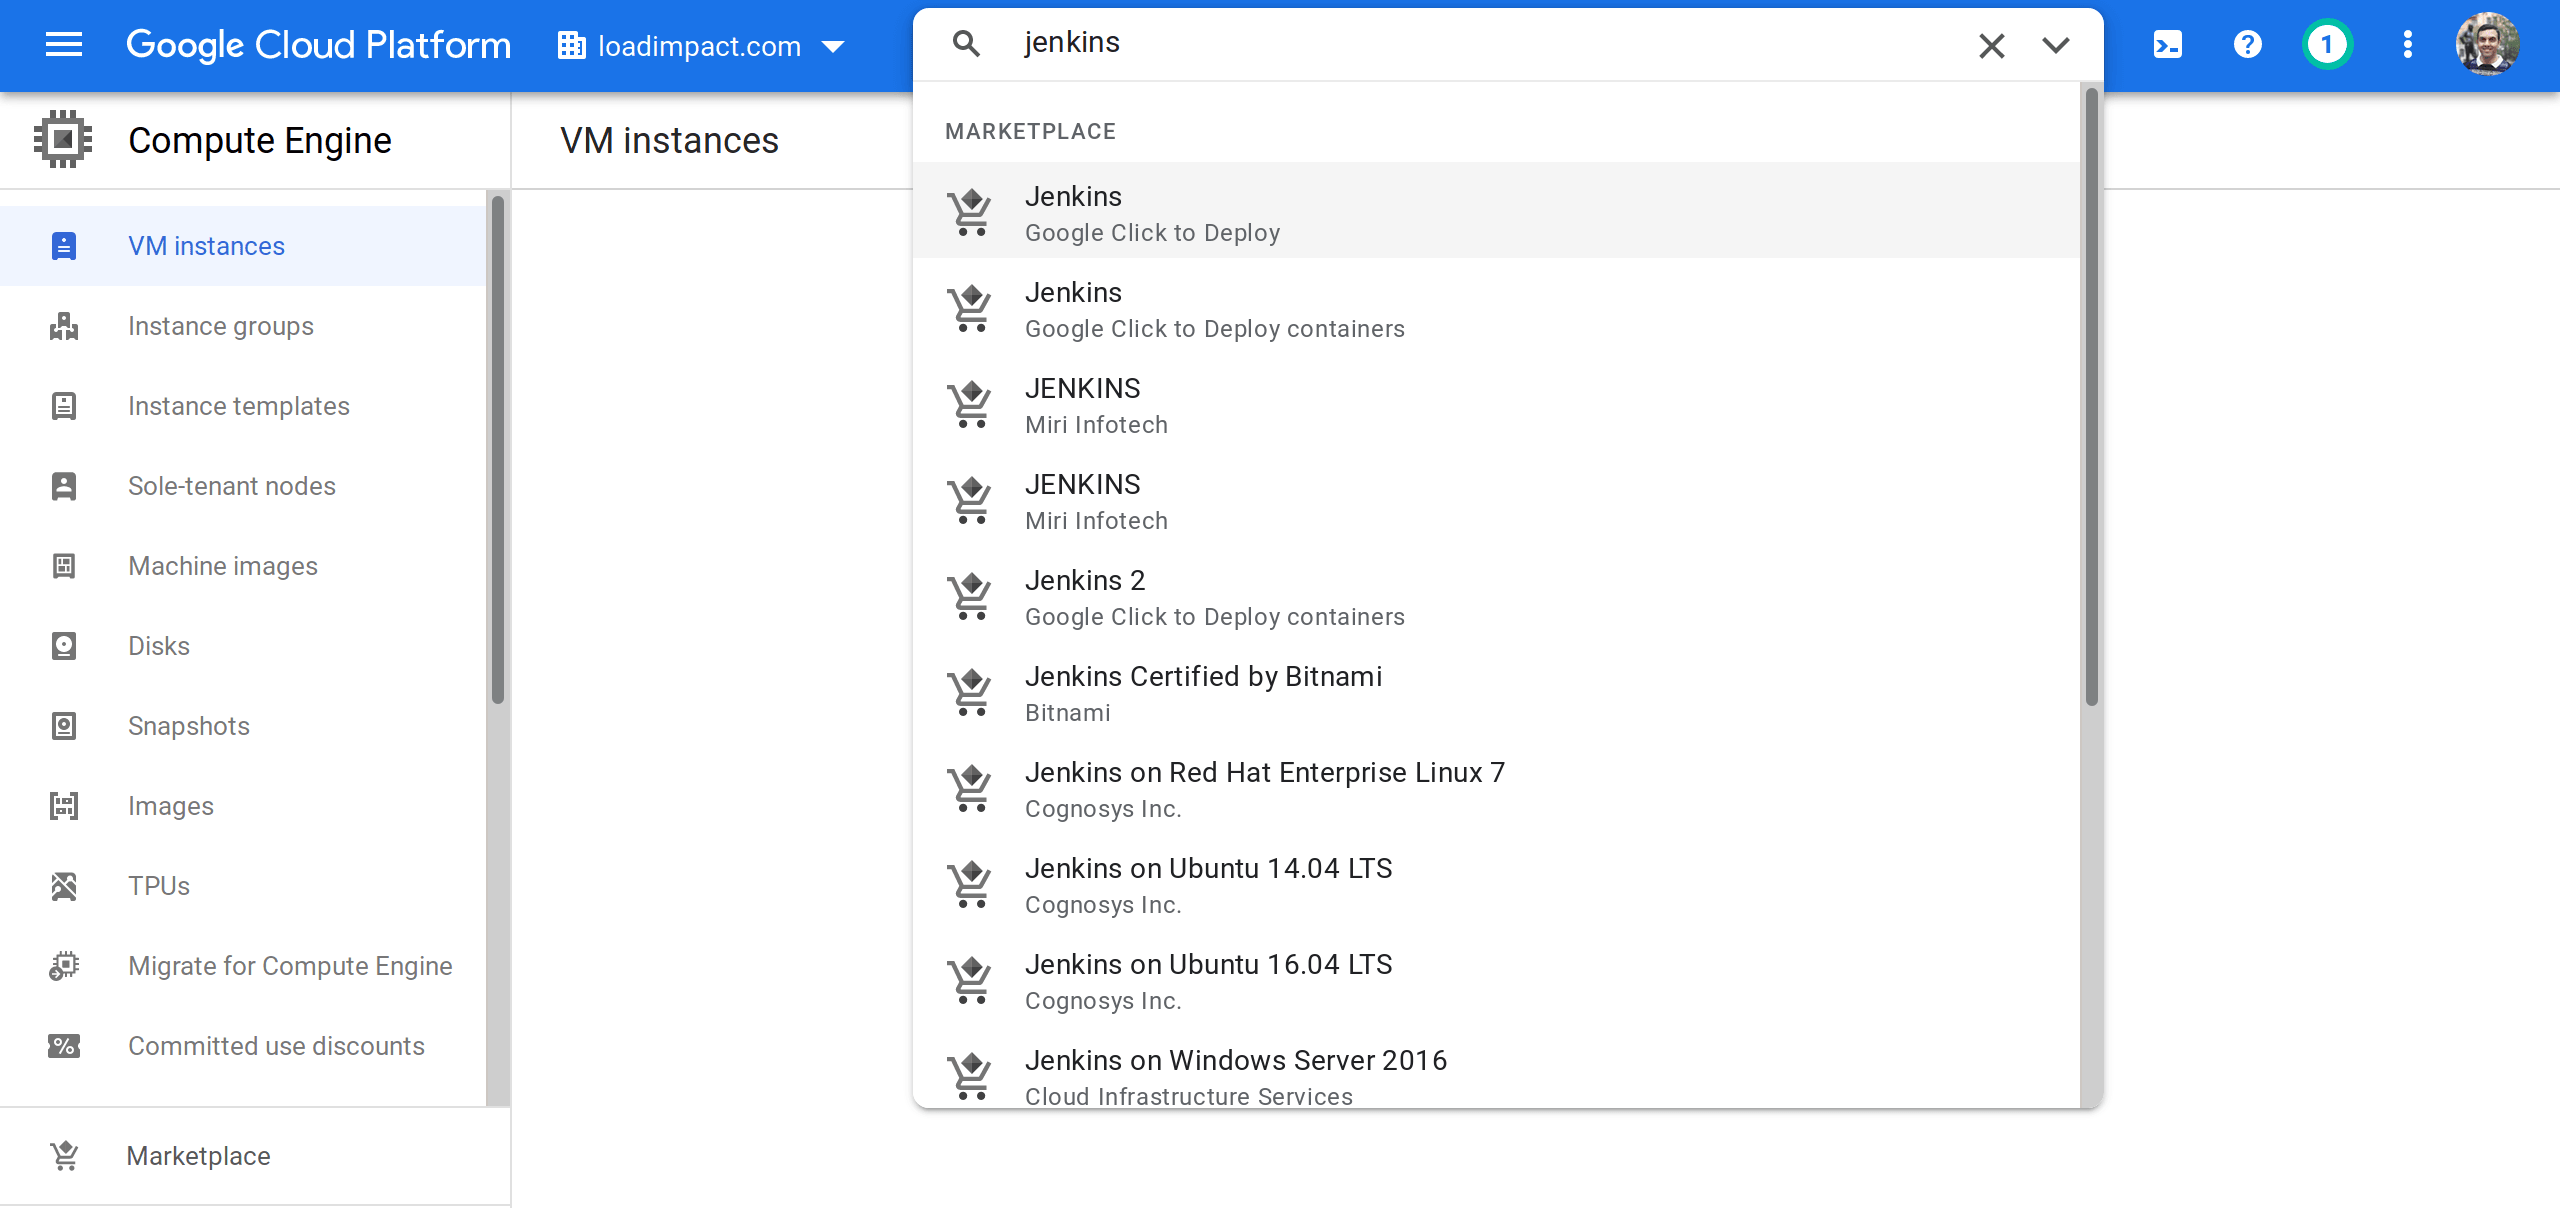
In this demonstration, we’ve installed Jenkins on a Google Compute Engine (GCE) instance on Google Cloud Platform (GCP). It’s pretty easy to get this up and running, use the Google Cloud Deployment Manager. Simply search for “jenkins” in the top search bar and select the Jenkins option with “click to deploy” which is the 1st option in the screenshot below. This will install Jenkins on a Debian GNU/Linux virtual machine as a GCE instance.
Further instructions will be provided by the GCP platform, which includes a Jenkins instance URL and credentials plus SSH access to the virtual machine.
Configuring the webhook
Assuming you have your GitHub repository set up and Jenkins pipeline job created, it’s time to integrate Jenkins with GitHub. You should create a token for the user on Jenkins and use that token along with the Jenkins instance URL to create the webhook.
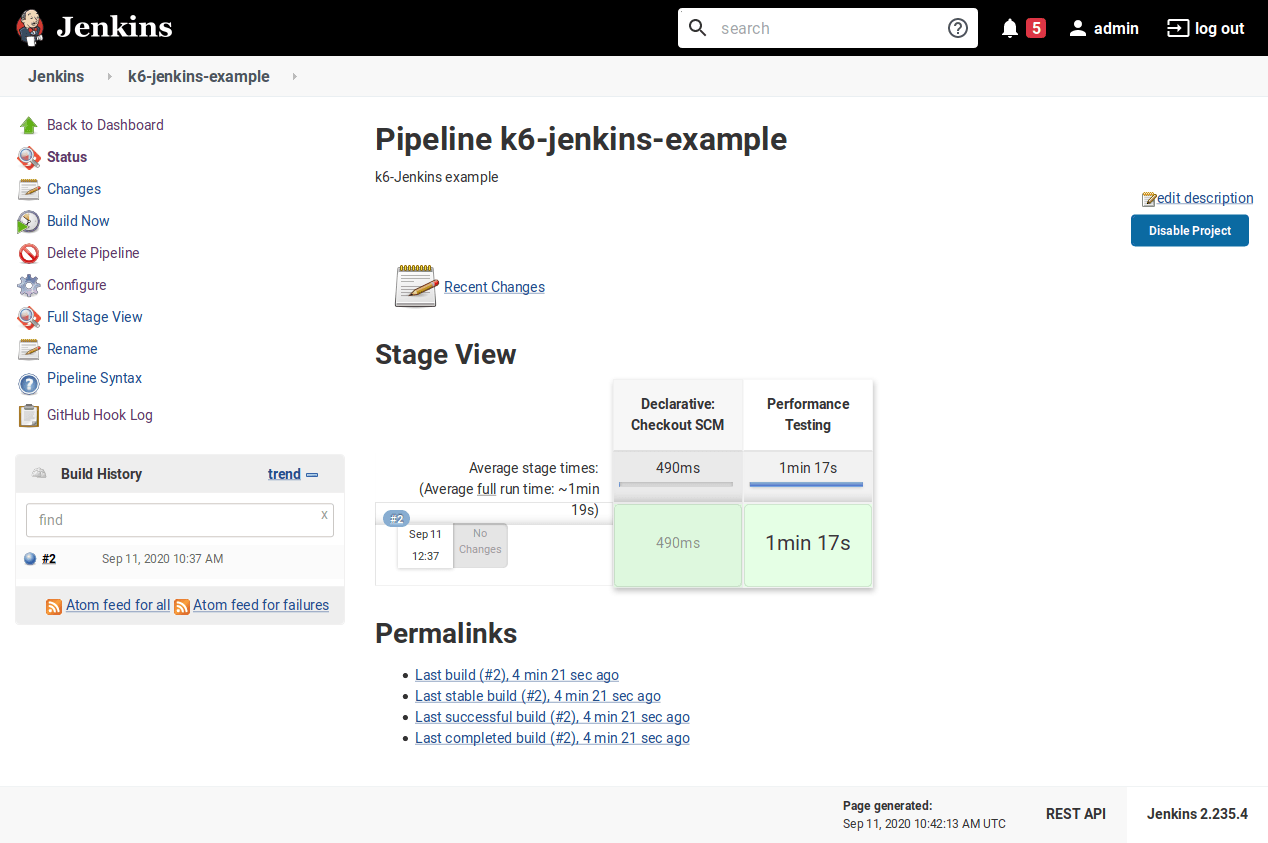
While in the Jenkins dashboard, head over to the pipeline you created and press Build Now to see the pipeline fetch the latest changes from your repository and run the tests.
Running Grafana Cloud k6 tests
There are two common ways to run k6 tests as part of a CI process:
- `k6 run` to run a test locally on the CI server.
- `k6 cloud run` to run a test on Grafana Cloud k6 from one or multiple geographic locations.
You might want to trigger cloud tests in these common cases:
- If you want to run a test from one or multiple geographic locations (load zones).
- If you want to run a test with high-load that will need more compute resources than provisioned by the CI server.
If any of those reasons fits your needs, then running Grafana Cloud k6 tests is the way to go for you.
Before we start with the Jenkins configuration, it is good to familiarize ourselves with how cloud execution works, and we recommend you to test how to trigger a cloud test from your machine.
Check out the guide to running cloud tests from the CLI to learn how to distribute the test load across multiple geographic locations and more information about the cloud execution.
After that, go to the Personal API token page on Testing & synthetics -> Performance -> Settings in Grafana Cloud k6 and copy your API token. You also need your project ID to be set as an environment variable. The project ID is visible under the project name in the Grafana Cloud k6 project page.
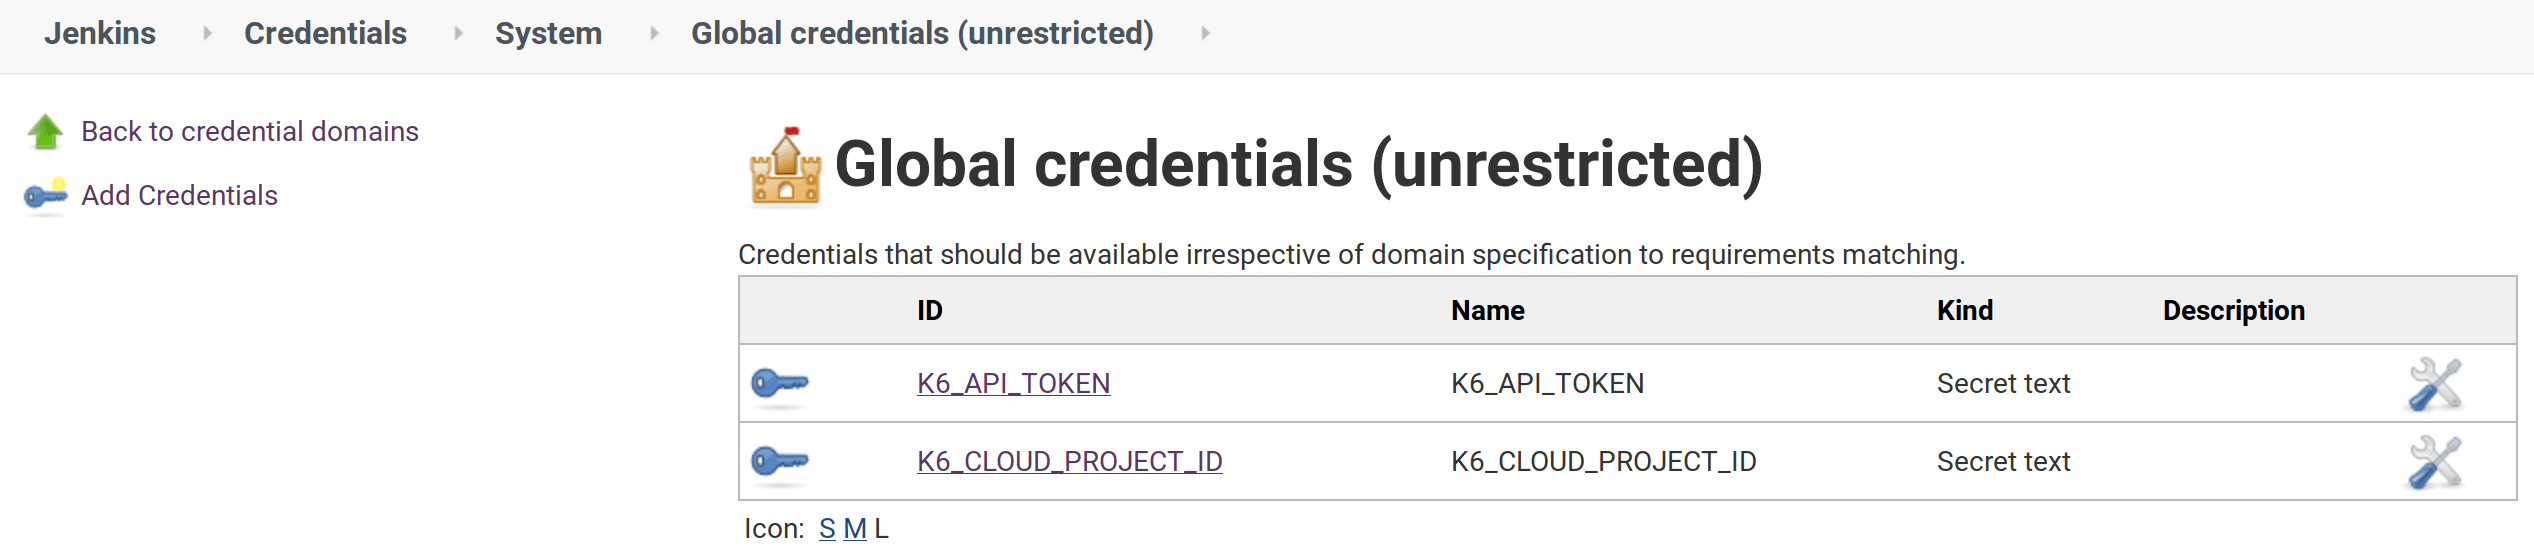
Head over to https://<jenkins-instance-url>/credentials/ and add K6_API_TOKEN to global credentials as secret text.
Now, you have to update the previous Jenkinsfile. It will look something like:
pipeline {
    agent any

    environment {
        K6_API_TOKEN=credentials("K6_API_TOKEN")
        K6_CLOUD_PROJECT_ID=credentials("K6_CLOUD_PROJECT_ID")
    }
    stages {
        stage('Performance Testing') {
            steps {
                echo 'Running K6 performance tests...'
                sh 'sudo chmod +x setup_k6.sh'
                sh 'sudo ./setup_k6.sh'
                sh 'k6 login cloud --token ${K6_API_TOKEN}'
                sh 'k6 cloud run loadtests/performance-test.js'
                echo 'Completed Running K6 performance tests!'
            }
        }
    }
}
The changes, compared to the previous configuration, are:
- Authenticate to Grafana Cloud k6 using
K6_API_TOKENenvironment variable when running the commandk6 cloud login --token ${K6_API_TOKEN}. - Add
K6_CLOUD_PROJECT_IDenvironment variable to specify the Grafana Cloud k6 project ID. - Replace the
k6 runcommand fork6 cloud runcommand to trigger cloud tests.
With that done, we can now go ahead and push the changes we’ve made in cloud-example/Jenkinsfile to our GitHub repository. This subsequently triggers Jenkins to build our new pipeline. Just keep in mind that since the changes to the Jenkinsfile is in another directory, you should also create a new pipeline job for it.
And when all is done and good, we should see a screen like this from Jenkins build page:
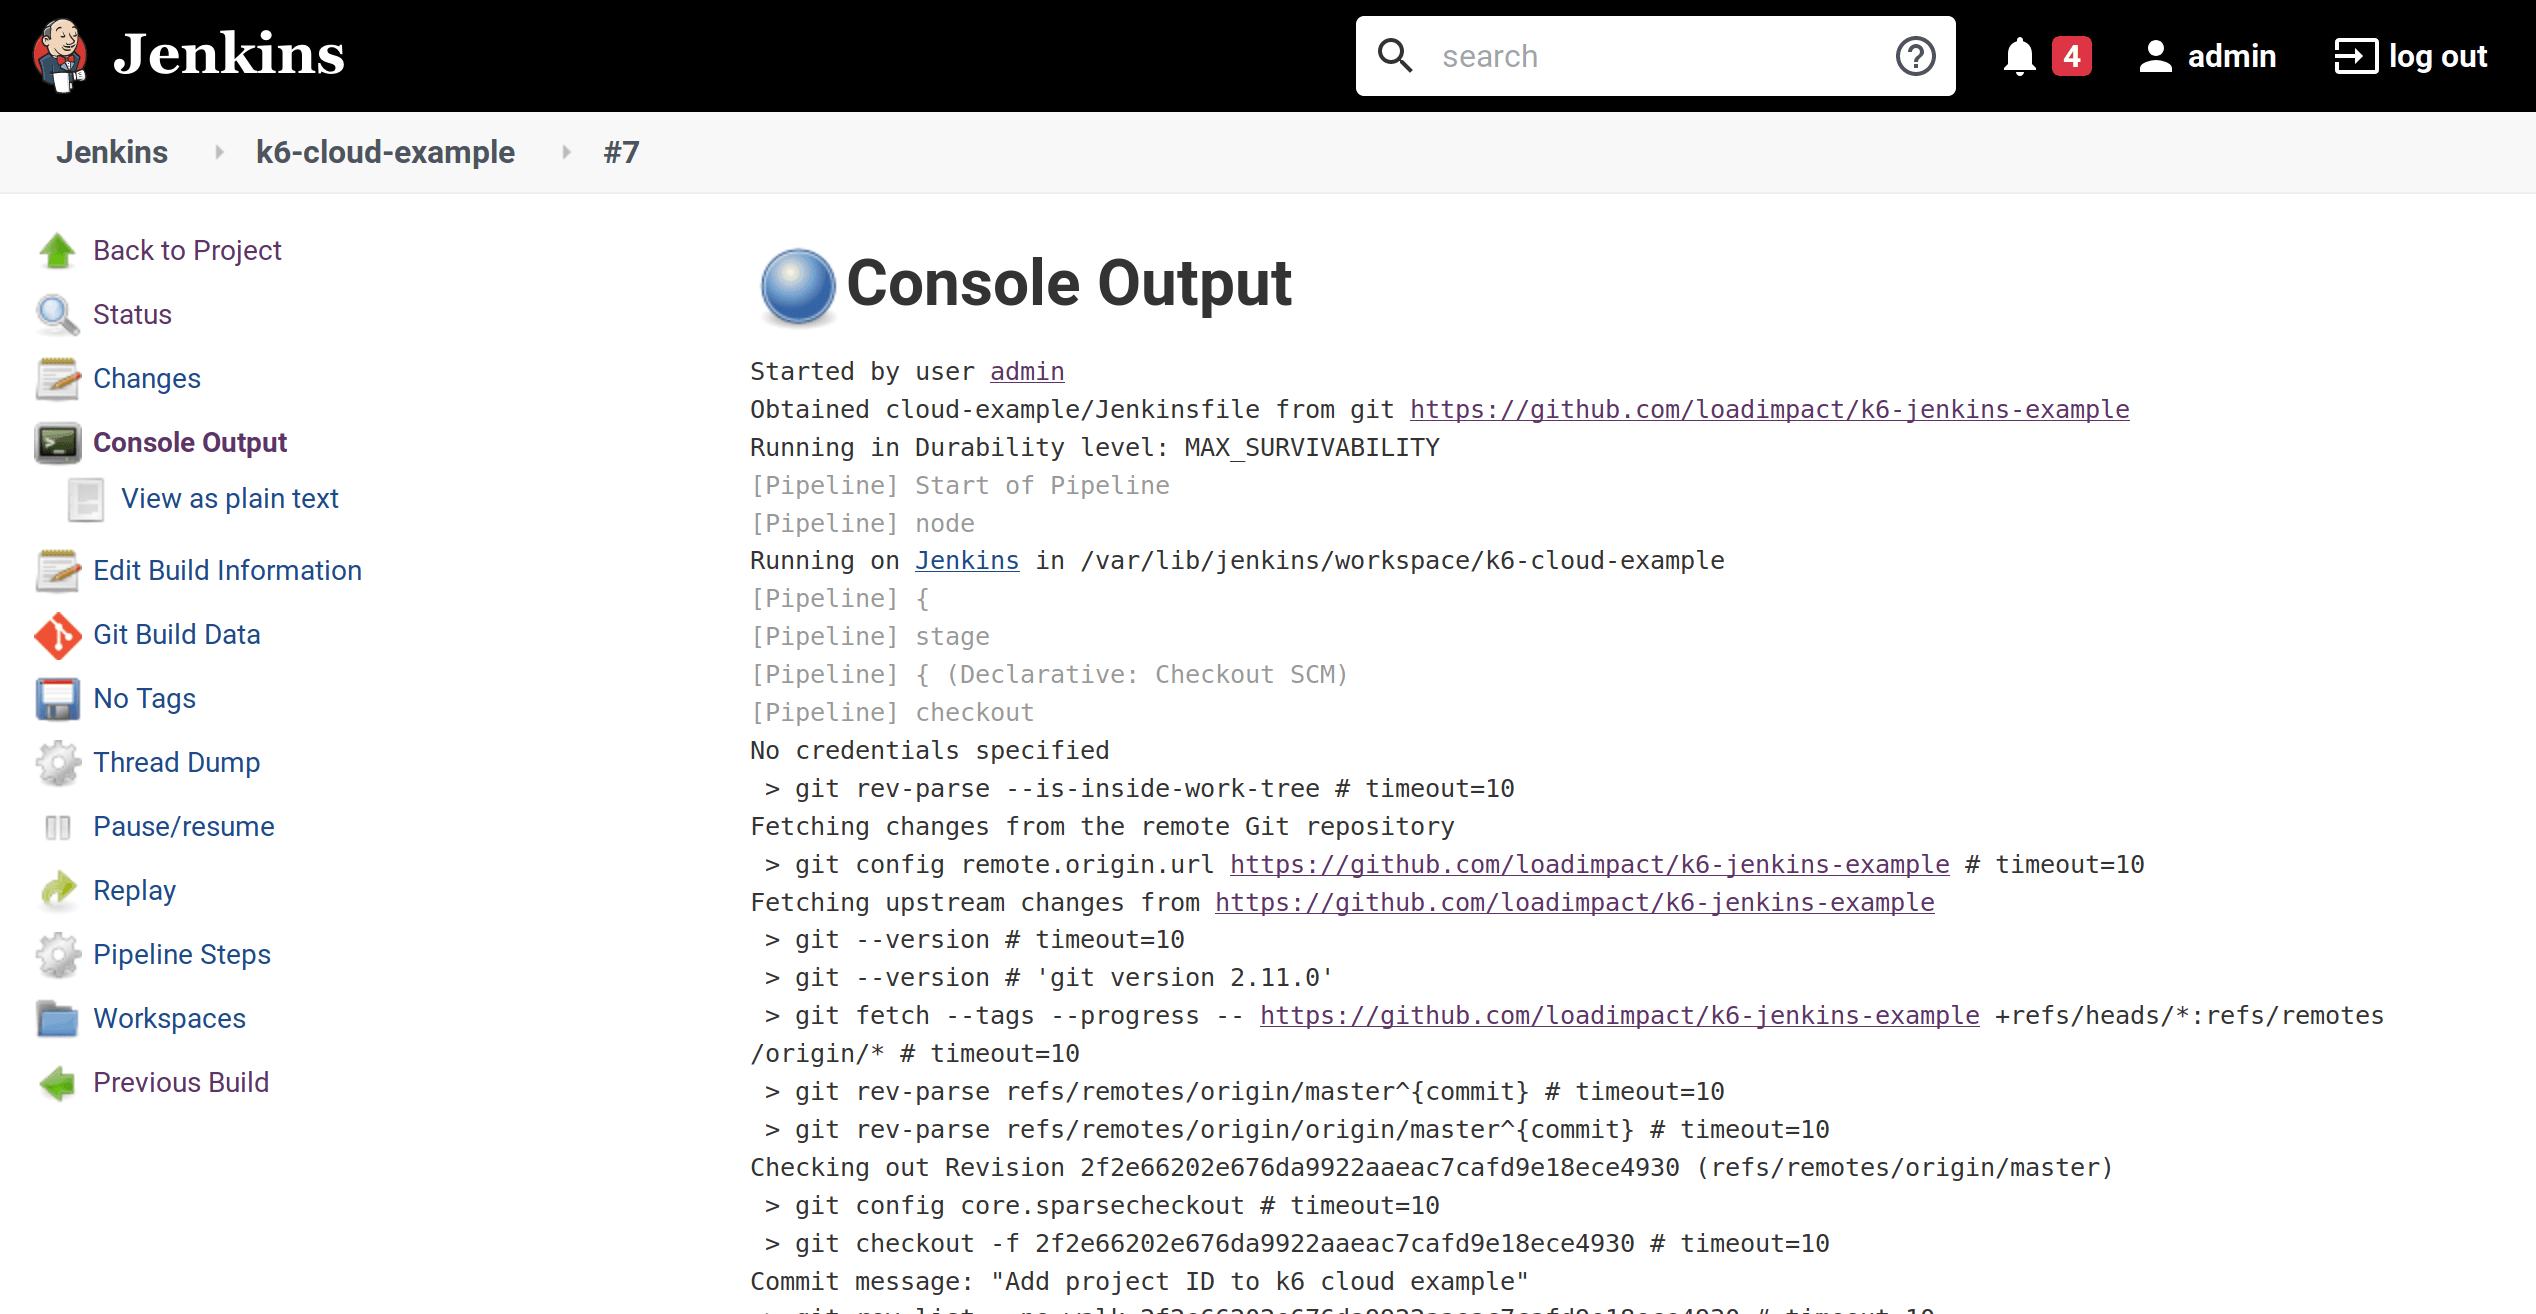
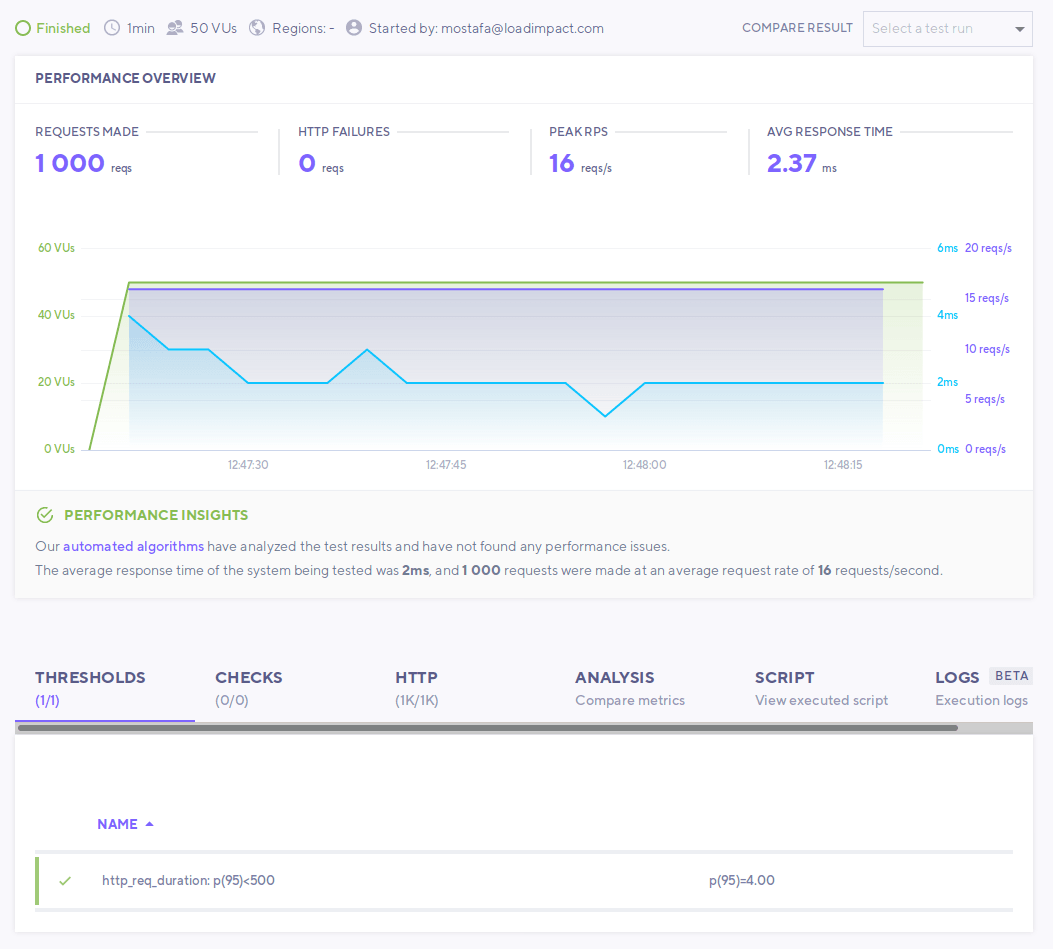
It is essential to know that Jenkins prints the output of the k6 command, and when running cloud tests, k6 prints the URL of the test result in Grafana Cloud k6. You could navigate to this URL to see the result of your cloud test.
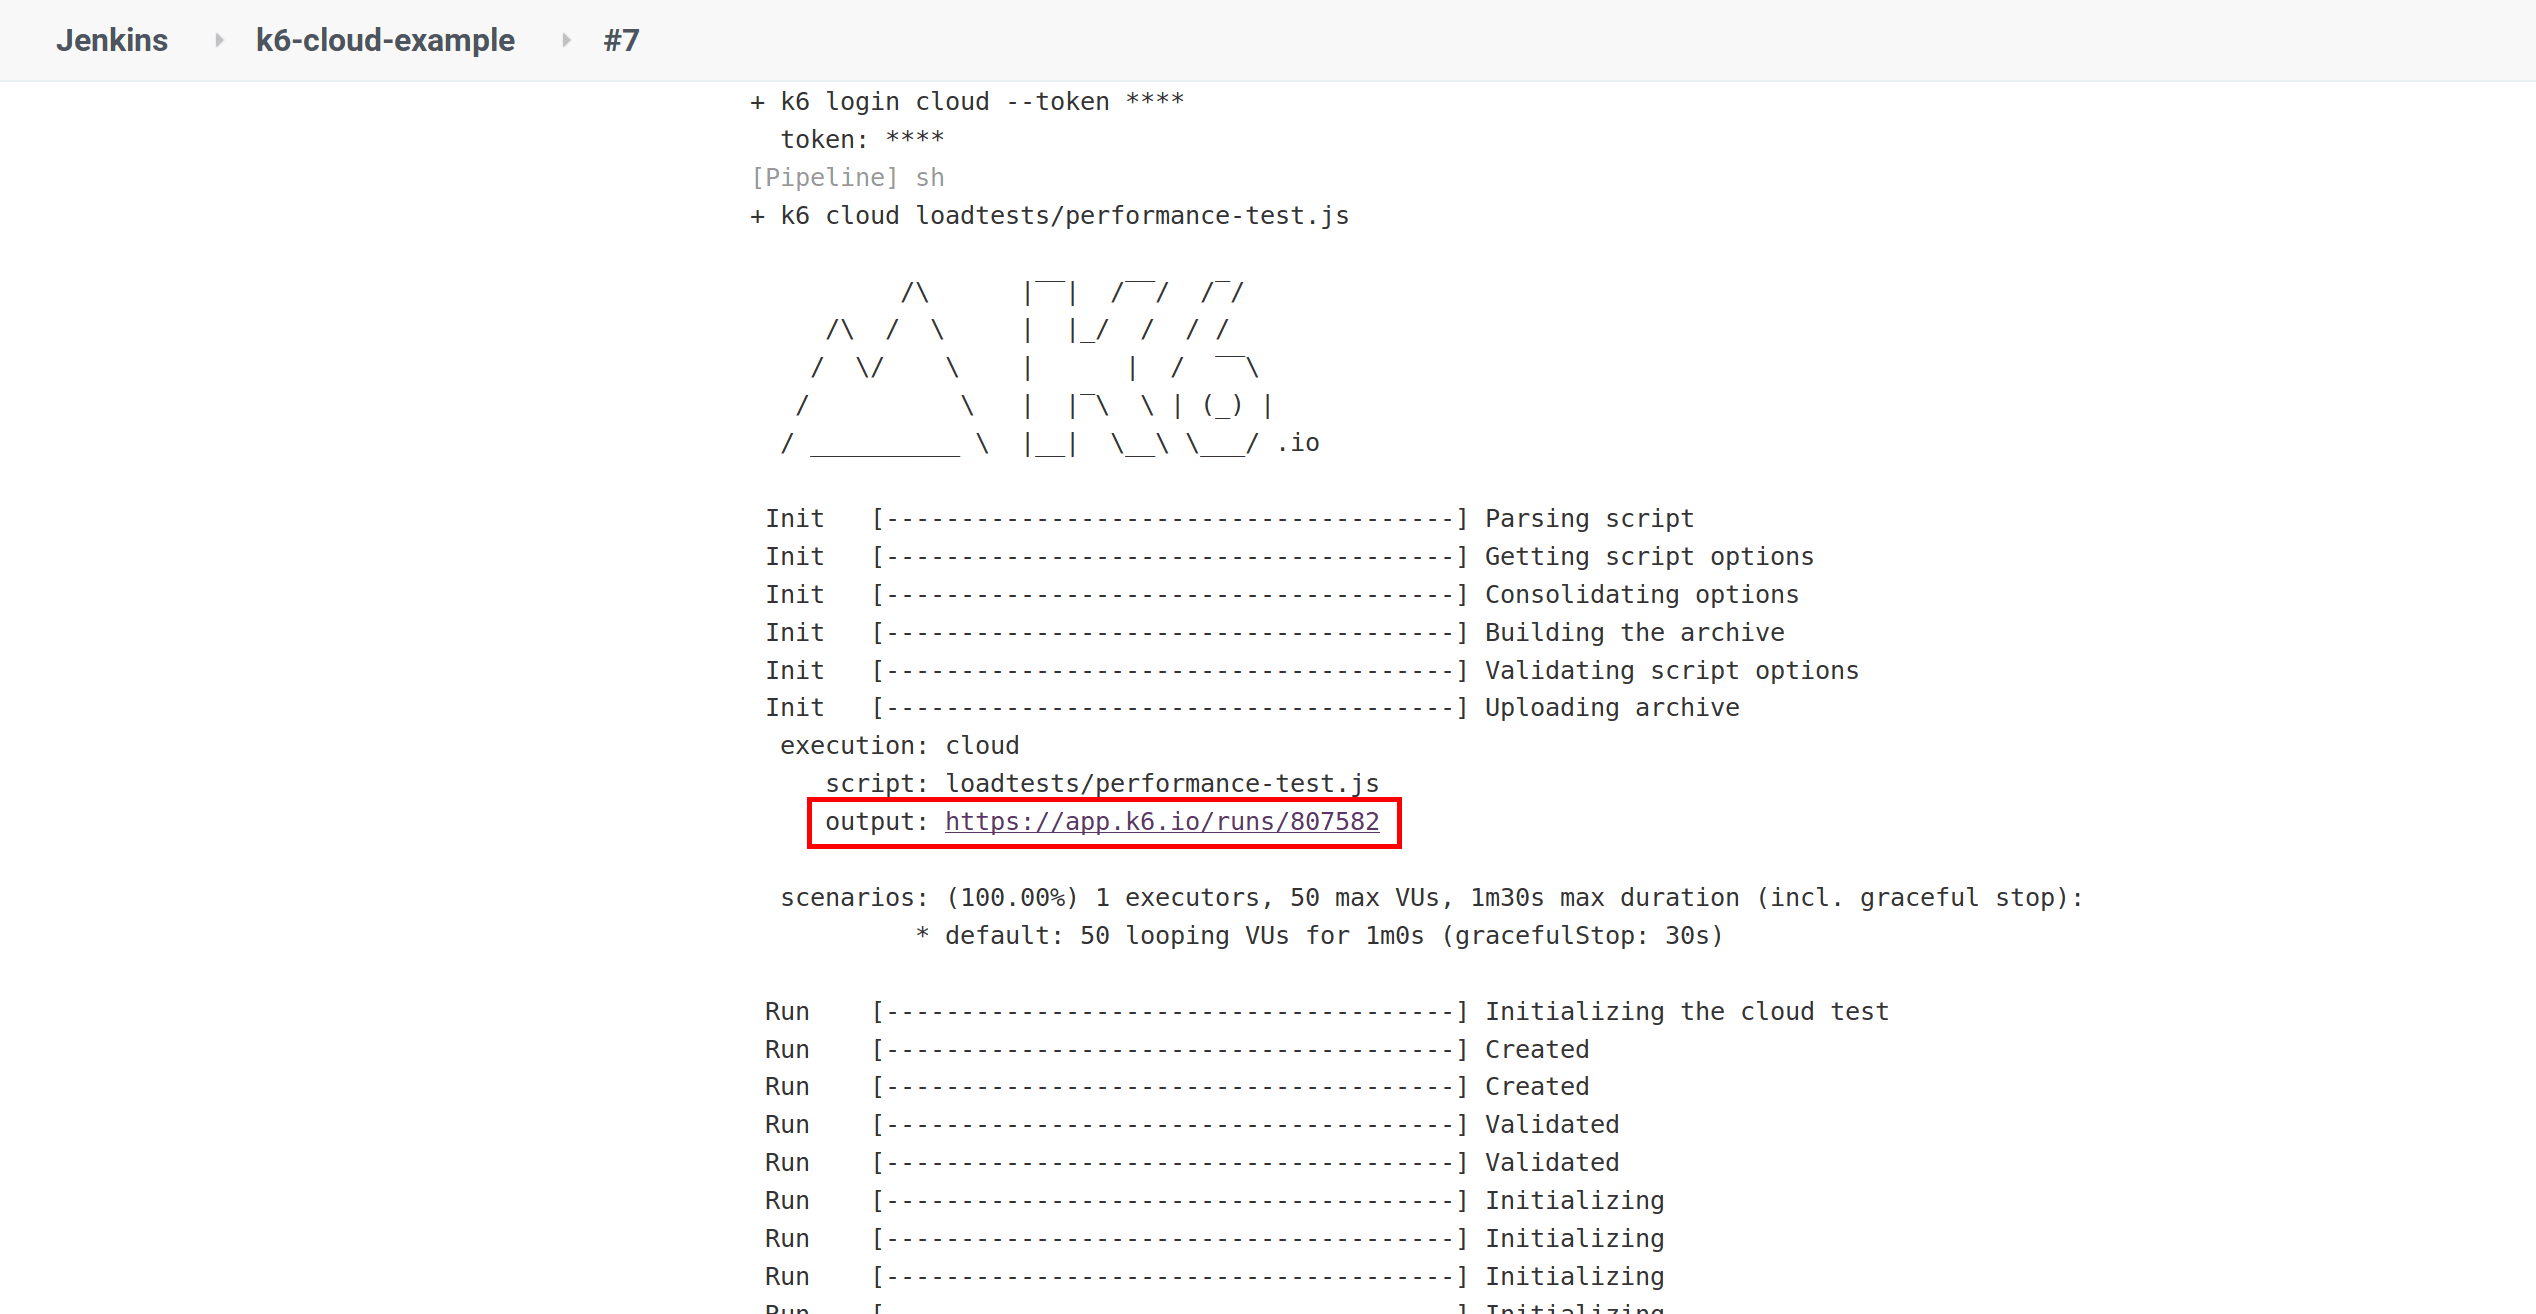
We recommend that you define your performance thresholds in the k6 tests in a previous step. If you have configured your thresholds properly and your test passes, there should be nothing to worry about. But when the test fails, you want to understand why. In this case, navigate to the URL of the cloud test to analyze the test result. The result of the cloud service will help you quickly find the cause of the failure.
Nightly triggers
It’s common to run some performance tests during the night when users do not access the system under test. For example, to isolate larger tests from other types of tests or to generate a performance report periodically.
To configure scheduled nightly build that runs at a given time of a given day or night, follow these steps:
- Head over to your Jenkins dashboard and click on your pipeline.
- Click on
configure. - Head over to the
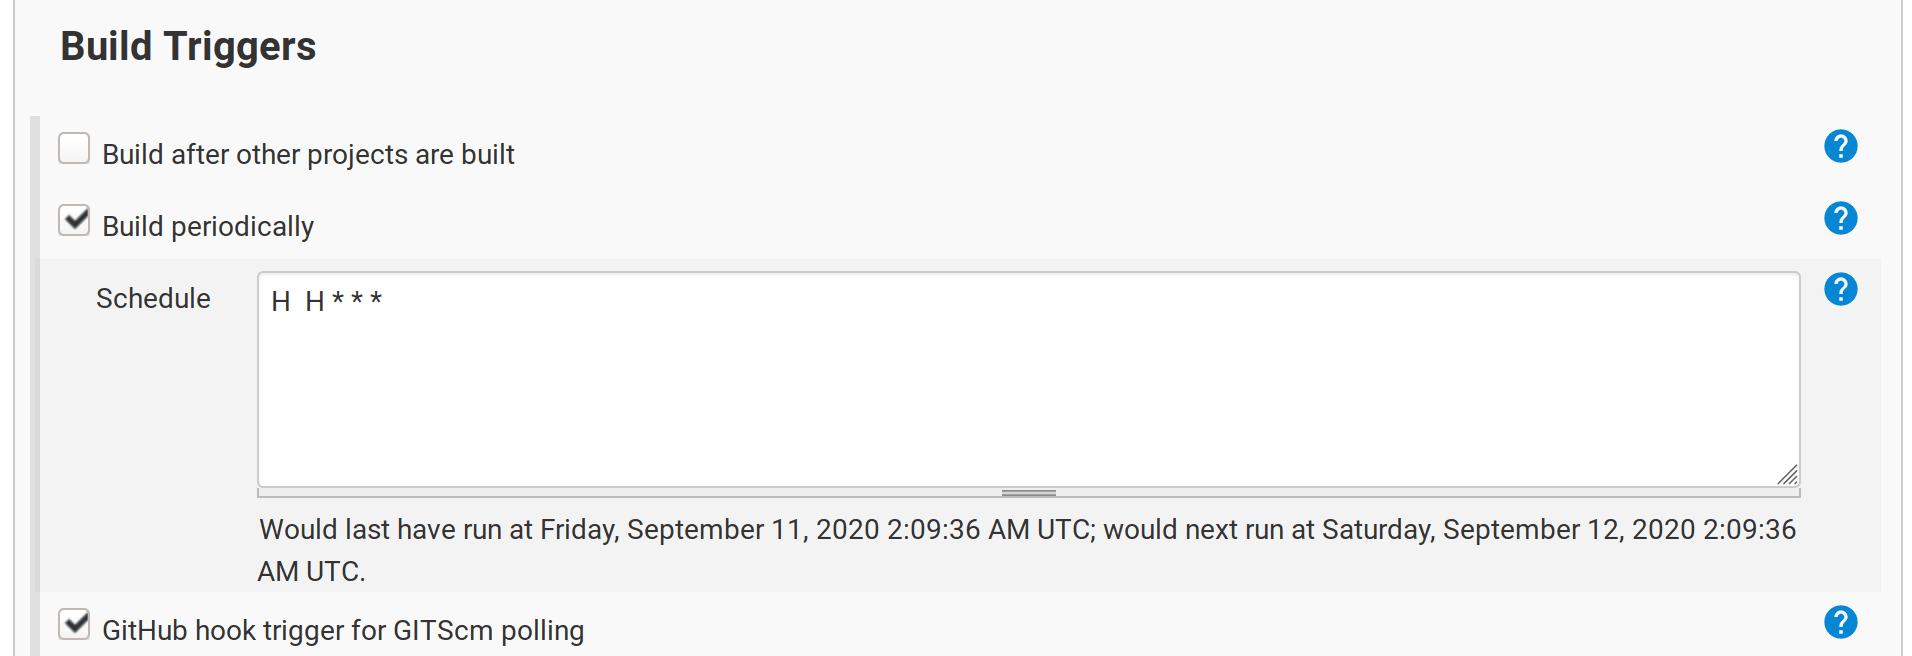
Build Triggers section and select thebuild periodicallycheckbox. - Fill in a cron-like value for the time you wish to trigger the pipeline execution at.
- Save the pipeline.
For example, to trigger a build at midnight everyday, the cron value of H H * * * will do the job. The screenshot below shows the same. You should be aware that the time zone is relative to the location where your Jenkins virtual machine is running. For this example, it is in UTC.
Hope you enjoyed reading this article. We’d be happy to hear your feedback.


