How to maximize span ingestion while limiting writes per second to a Scylla backend with Jaeger tracing
Jaeger primarily supports two backends: Cassandra and Elasticsearch. Here at Grafana Labs we use Scylla, an open source Cassandra-compatible backend. In this post we’ll look at how we run Scylla at scale and share some techniques to reduce load while ingesting even more spans. We’ll also share some internal metrics about Jaeger load and Scylla backend performance.
Special thanks to the Scylla team for spending some time with us to talk about performance and configuration!
Scylla performance
Scylla performs admirably even in an unoptimized configuration. Scylla warns of the performance hit for running in Docker and how to best mitigate that in GKE. Despite not attempting these advanced tunings, we are still happy with the performance of Scylla.
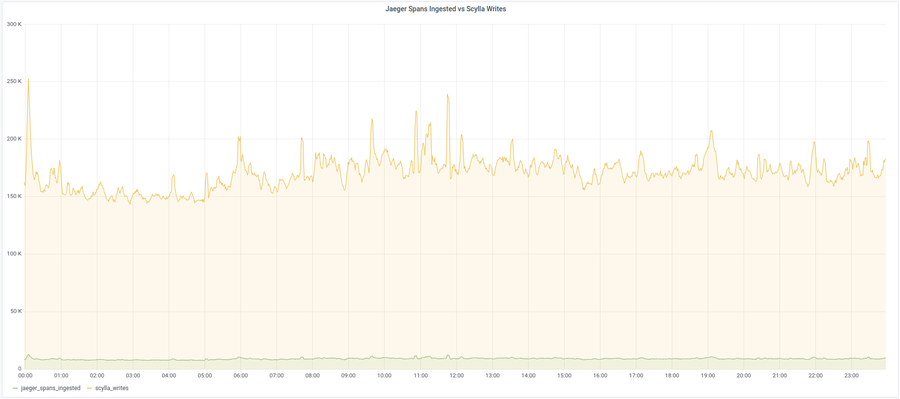
At Grafana Labs we have deployed the Scylla image to GKE with default settings and are still getting ~175k writes per second (after replication) for around ~20 cores and ~95 GB of memory. If you’re just getting started with Scylla in Kubernetes check out the Scylla operator.

Backend load
So Scylla is handling ~175k writes/second, but if we check our Jaeger metrics, we’re only ingesting ~8k spans/second. Where are all of these writes coming from? In Jaeger, the number of writes/second to Scylla is a direct multiplier on the number of spans/second. Let’s investigate the source of all of these writes.

Jaeger is open source! It’s easy to review the schema as well as the code actually writing the indexes. By reviewing the code, we can see how Jaeger uses a key value backend to support search by service, operation, duration, and tags. For every span ingested the following rows are inserted:
1 row for service name index
1 row for service/operation name index
1 row for traces index
2 rows for the duration index
- One searches by service name and the second searches by both service and operation name.
N rows for every tag associated with the span
- N is the average number of tags per span in your environment. Keep in mind that all tags, process tags, and every tag for every log are indexed by default. For instance, the following span would result in 12 writes to the tag index:

2x for replication factor
- By default the schema create script uses a replication factor of 2x, but this is configurable at creation time.
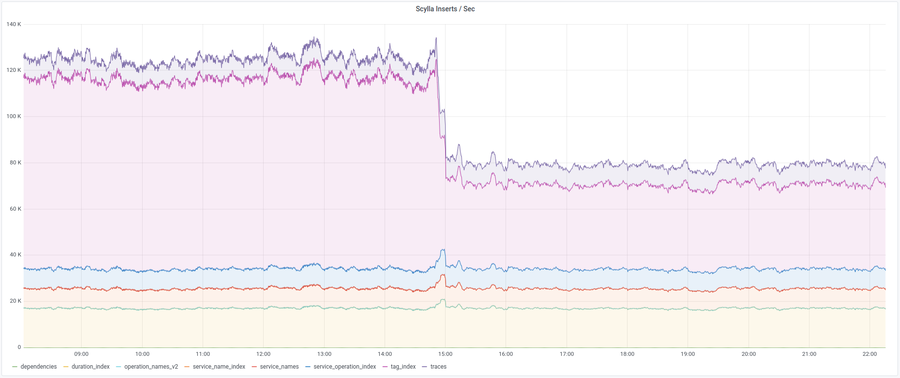
Everyone’s distribution will be a little different (depending on your average tags per span), but at Grafana Labs, the majority of our writes are, unsurprisingly, the tags index at 40k/second. The above analysis proved to be correct: We are writing ~8k/second to the service name, service operation, and trace index, and ~16k/second to the duration index.

Reducing load and increasing spans
The most obvious way to reduce load is to adjust sampling rates. At Grafana Labs, we highly recommend making use of the Jaeger remote sampler, which allows an operator to control sampling rates for all applications from a central location. This is necessary in a larger install with multiple consumers of the Jaeger backend, as it enables the operator to reduce sampling on processes producing too many spans.
Indexing flags
However, reducing spans will also limit our vision on our applications, and naturally, we want to ingest as many spans/second as possible. Thankfully, Jaeger has some configurable options to allow us to control the number of tags written/second. This can help us reduce the largest block of writes to Scylla.
--cassandra.index.logs
  Controls log field indexing. Set to false to disable. (default true)
--cassandra.index.process-tags
  Controls process tag indexing. Set to false to disable. (default true)
--cassandra.index.tag-blacklist string
  The comma-separated list of span tags to blacklist from being indexed. All
  other tags will be indexed. Mutually exclusive with the whitelist option.
--cassandra.index.tag-whitelist string
  The comma-separated list of span tags to whitelist for being indexed. All
  other tags will not be indexed. Mutually exclusive with the blacklist option.
--cassandra.index.tags
  Controls tag indexing. Set to false to disable. (default true)
This is our configuration, but you should really tailor this to your needs:
index:
  tag-blacklist: client-uuid,span.kind,component,internal.span.format,ip,jaeger.version,sampler.type,sampler.param,http.method
  logs: false
Adding the above configuration reduced our total writes to the backend by about 33%. Our tag index writes/second went from ~85k to ~40k.

Firehose mode
In Jaeger, there is another option to reduce index writes/second. We can mark a span as being in “firehose” mode. This is a way to designate that an individual application or span requires less indexing. A firehose span will skip indexing by tags, logs, and duration. It can be useful if a team wants to make a huge number of spans, but doesn’t need all of the indexing.
An example using OpenTracing with Jaeger bindings in Go:
span := tracer.StartSpan("blerg")

jaegerSpan, ok := span.(*jaeger.Span)
if ok {
  jaeger.EnableFirehose(jaegerSpan)
}
Wrappin’ ’er up
Overall we are happy with the performance and stability of Scylla at Grafana Labs. With Scylla 3.1.1, we were able to run a cluster and ignore it for many months – generally handling 175k writes/second, and even as many as ~250k writes/second, over this time period. With the proper configuration, we’d see even better performance.
If you’re interested in learning more about distributed tracing using Jaeger, Loki, and Grafana, join me on Aug. 6 for my webinar, “Introduction to distributed tracing.” You can sign up here to watch live or get a link to access the recording on demand.
A final note: Make sure to use Jaeger’s configuration options to reduce writes to your backend, allowing you to ingest even more spans and better serve your developers!


