
Getting started with the Grafana Cloud Agent, a remote_write-focused Prometheus agent
Greetings! This is Eldin reporting from the Solutions Engineering team at Grafana Labs. In previous posts, you might have read about Grafana’s New 7 release or our introduction to Loki. In this week’s post, I am introducing Éamon, who will be covering our Grafana Agent. – Eldin
Hi folks! Éamon here. I’m a recent-ish addition to the Solutions Engineering team and just getting my feet wet on the blogging side so bear with me. :)
Back in March, we introduced the Grafana Agent, a remote_write-focused Prometheus agent. The Grafana Agent is a subset of Prometheus without any querying or local storage, using the same service discovery, relabeling, WAL, and remote_write code found in Prometheus.
With the recent major release, v0.4.0, the Grafana Agent now includes support for “integrations”! Integrations are embedded exporters that can scrape metrics on your behalf and remote_write them, so you don’t have to configure Prometheus or install an exporter yourself. So essentially you can think of them like easy-mode exporters.
There are two integrations supported in this release:
- node_exporter: allows the Agent to scrape metrics from a UNIX-based host
- agent: allows the Agent to scrape metrics from itself
Additionally, you can still configure exporters manually and then scrape them as normal as part of the same agent configuration.
Today, I’m going to show you two examples of basic configurations for the Agent. I’ll cover some more advanced ones in future posts.
Example 1: Configuring node_exporter and agent
The first example will involve configuring the two new integrations mentioned above. I’ll be using my local machine, which runs as the target for where the Agent will run, but this would work against any UNIX / Linux type machine. I’ll also be sending my metrics to a Grafana Cloud Prometheus endpoint, but as Robert Fratto mentioned in the previous blog post, you could have your target be any remote_write compatible endpoint.
First, I’ll download the agent to my machine.
For reference, my machine’s hostname is grafana-labs-eamon.
I’m grabbing the latest release:
wget https://github.com/grafana/agent/releases/download/v0.4.0/agent-linux-amd64.zip
unzip agent-linux-amd64.zip
Now I just need to set up a basic config file for the agent.
Here’s a mostly complete example; you would just need to provide your own prometheus_remote_write URL if you are using something that isn’t Grafana Cloud, as well as your own username/password (API key).
server:
  log_level: info
prometheus:
  wal_directory: /tmp/wal
  global:
    scrape_interval: 15s
integrations:
  agent:
    enabled: true
  node_exporter:
    enabled: true

  prometheus_remote_write:
   - url: https://prometheus-us-central1.grafana.net/api/prom/push
     basic_auth:
       username: <your-username>
       password: <your-password>
I’m saving the file as agent.yaml, but the name can be anything.
Then I just need to execute the agent, passing the config file.
./agent-linux-amd64 -config.file agent.yamlIf everything’s good, a whole lot of messages will scroll by related to the two integrations, agent and node_exporter, with messages for each that include the text Done replaying WAL at the end. If you see these, your metrics should be available both locally and on your Prometheus endpoint.
I want to verify that, though, so first I’ll check my local metrics endpoint. Since by default the port of server is set to 12345, I’ll check http://localhost:12345/metrics:
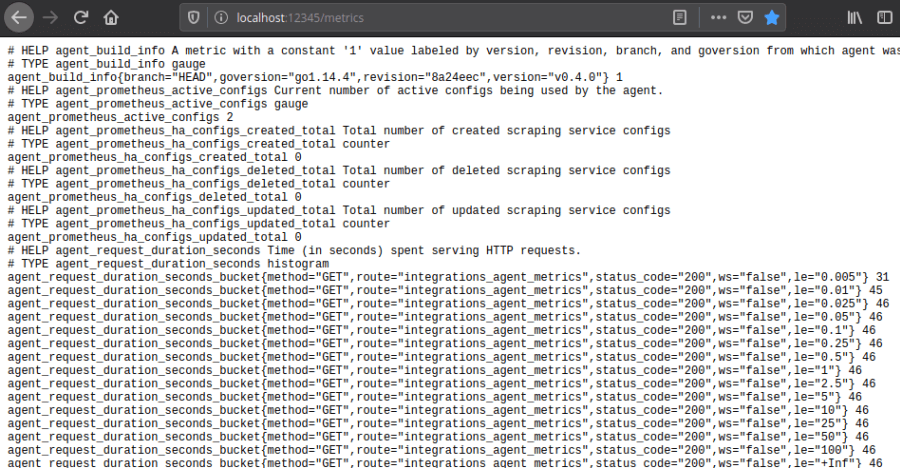
Notice there are now a bunch of metrics available prefixed with agent_. This is good; we now know the agent is producing metrics.
An experienced user of node_exporter might look closely at this page and say, “Okay, but where are the node exporter metrics?”
This is a great question. When using the Agent’s integrations, the metrics for those integrations are each actually available at a slightly different path. The reason for this is so that they can be scraped separately. For example, the node_exporter metrics could be configured to be scraped every 5 minutes, while the agent metrics could be scraped every 1 minute if desired.
So to find the node_exporter raw metrics, I’ll go to http://localhost:12345/integrations/node_exporter/metrics.
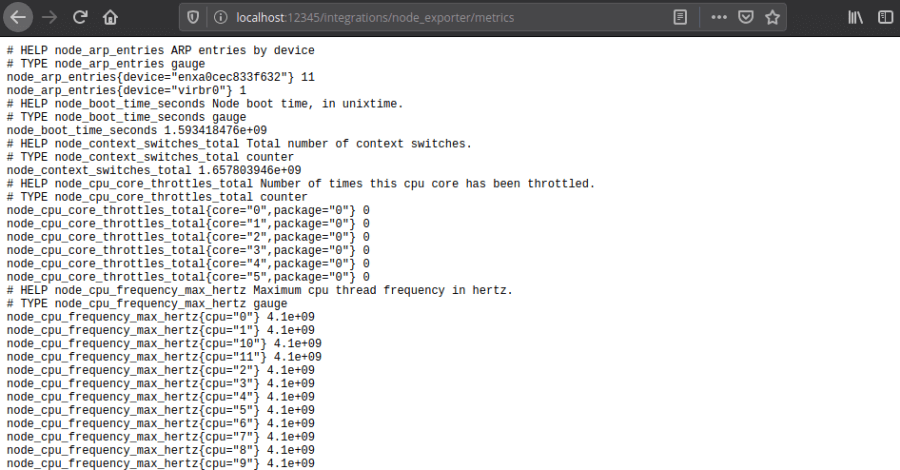
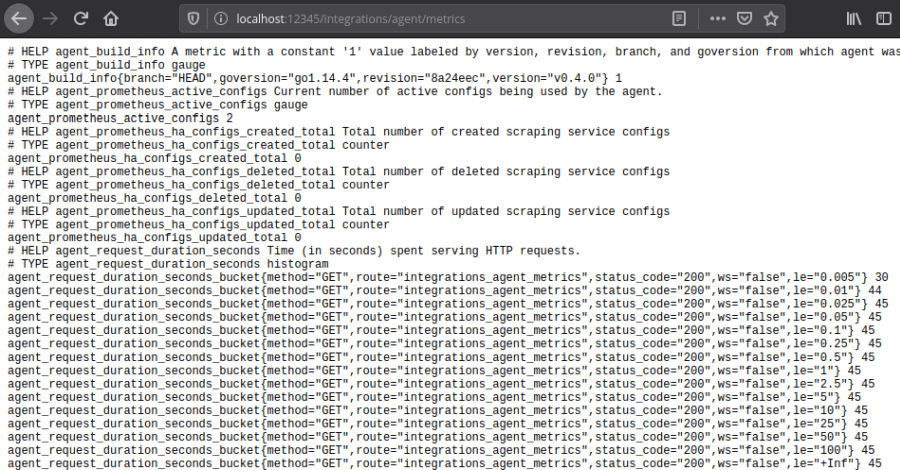
Now, you might say, “But Éamon, didn’t you say the agent metrics themselves are an integration? Why aren’t they available at a similar path?”
The answer is they actually are available at both the root /metrics path as well as /integrations/agent/metrics, and the content is identical:
So now that I know my metrics are being served locally, I want to check to see if I can see them on Grafana Cloud.
For the Agent metrics, I’m using a slightly modified version of the example dashboard from Robert located here. I’ve just changed instance to agent_hostname, as this shows the true machine hostname instead of a localhost address. We’ll get a more finalized version of this dashboard placed on the https://grafana.com/grafana/dashboards site once we do a bit more work on it, but you can use this for now if you’d like to try it.
Here is how mine turned out:
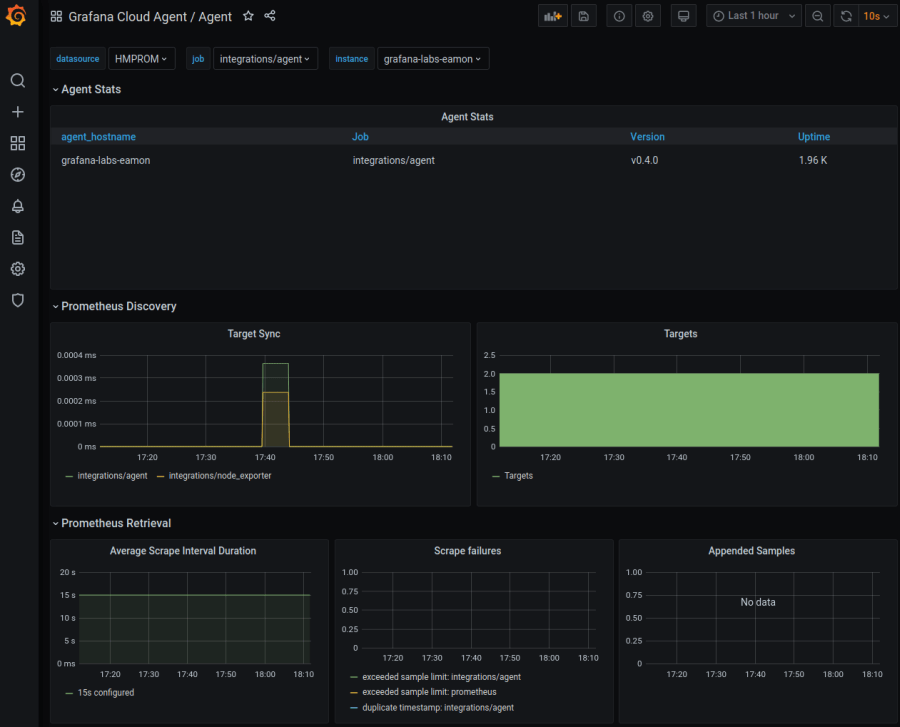
From here I can tell that my Agent is working and I’m receiving metrics from it.
Now onto the node_exporter.
I’ve taken one of the many “Node Exporter for Prometheus” dashboards for this and modified the panels and dashboard variables to use agent_hostname. Ideally, of course, it would be a bit easier to have both Agent and non-Agent node_exporter metrics in the same view. We’re going to look at solutions for that internally, but for now this works pretty well.
Let’s take a look!
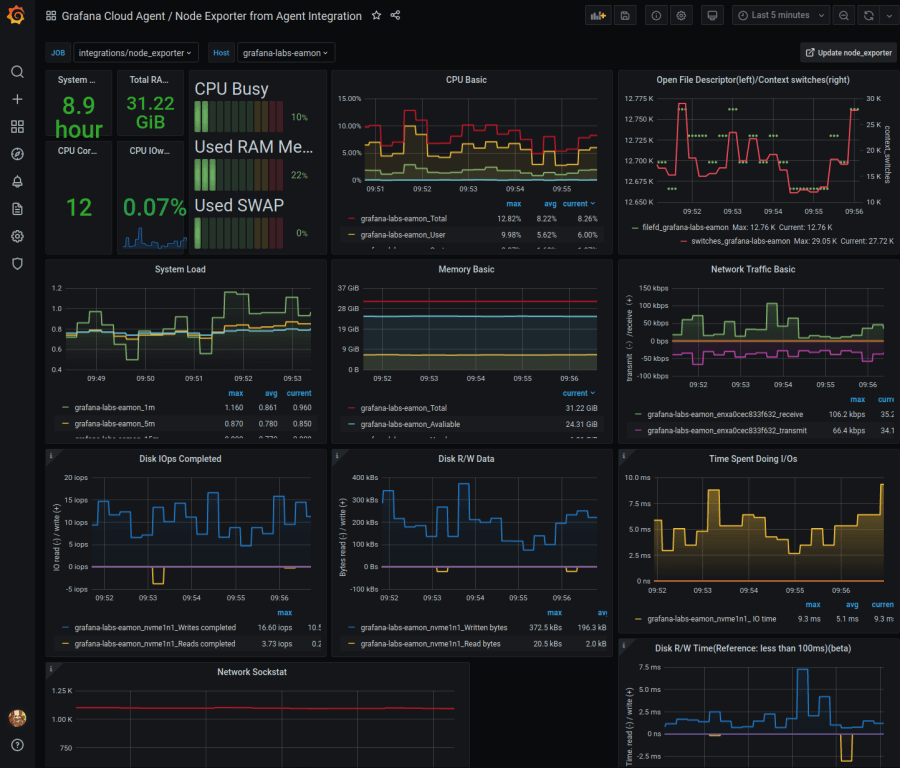
Excellent! With an extremely minimal config file, I’ve now configured the Grafana Agent to send metrics both about itself and my machine via automatically setting up the node_exporter integration for me.
If you want to use my dashboard as a reference, it’s available for download here.
Note: If you are conscious of how many metrics you are sending, you can always disable the agent integration, reserving it for troubleshooting purposes only if desired. Other exporters will still function.
Example 2: Adding a manual scrape config
The second example I want to show today involves enhancing my configuration to add a manual scrape config. This will be something that is not an automatic integration today (but may be in future).
I’ve chosen blackbox_exporter for this. This exporter’s purpose is to probe endpoints over HTTP, HTTPS, DNS, TCP, and ICMP.
So I’m going to:
- Download and configure the blackbox_exporter.
- Start the exporter.
- Add the scrape config for the exporter to my agent config.
- Restart the agent and see that the metrics are visible in Grafana Cloud.
First, I’ll download and extract the latest release of the exporter:
wget https://github.com/prometheus/blackbox_exporter/releases/download/v0.17.0/blackbox_exporter-0.17.0.linux-amd64.tar.gz
tar xvf blackbox_exporter-0.17.0.linux-amd64.tar.gz
cd blackbox_exporter-0.17.0.linux-amd64
Next I’ll create a very basic config file (http only) and save it as blackbox-grafana.yaml:
modules:
  http_2xx:
    prober: http
    timeout: 5s
    http:
      valid_http_versions: ["HTTP/1.1", "HTTP/2.0"]
      valid_status_codes: []  # Defaults to 2xx
      method: GET
      headers:
        Host: grafana.com
        Accept-Language: en-US
        Origin: grafana.com
      no_follow_redirects: false
      fail_if_ssl: false
      fail_if_not_ssl: false
      fail_if_body_matches_regexp:
        - "Could not connect to database"
      fail_if_header_matches: # Verifies that no cookies are set
        - header: Set-Cookie
          allow_missing: true
          regexp: '.*'
      fail_if_header_not_matches:
        - header: Access-Control-Allow-Origin
          regexp: '(\*|grafana\.com)'
      tls_config:
        insecure_skip_verify: false
      preferred_ip_protocol: "ip4" # defaults to "ip6"
      ip_protocol_fallback: false  # no fallback to "ip6"
Now, I’ll start my new blackbox_exporter with the config file:
/blackbox_exporter --config.file blackbox-grafana.yamlThe output has a last line that looks like this if things are good:
level=info ts=2020-07-01T19:46:15.018Z caller=main.go:369 msg="Listening on address" address=:9115Next, I’ll access http://localhost:9115 to verify the exporter is accessible locally:
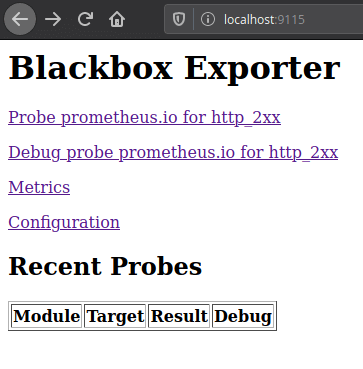
I can see that so far, there have been no probes, so I’ll force one manually by visiting http://localhost:9115/probe?target=grafana.com&module=http_2xx.
The result:
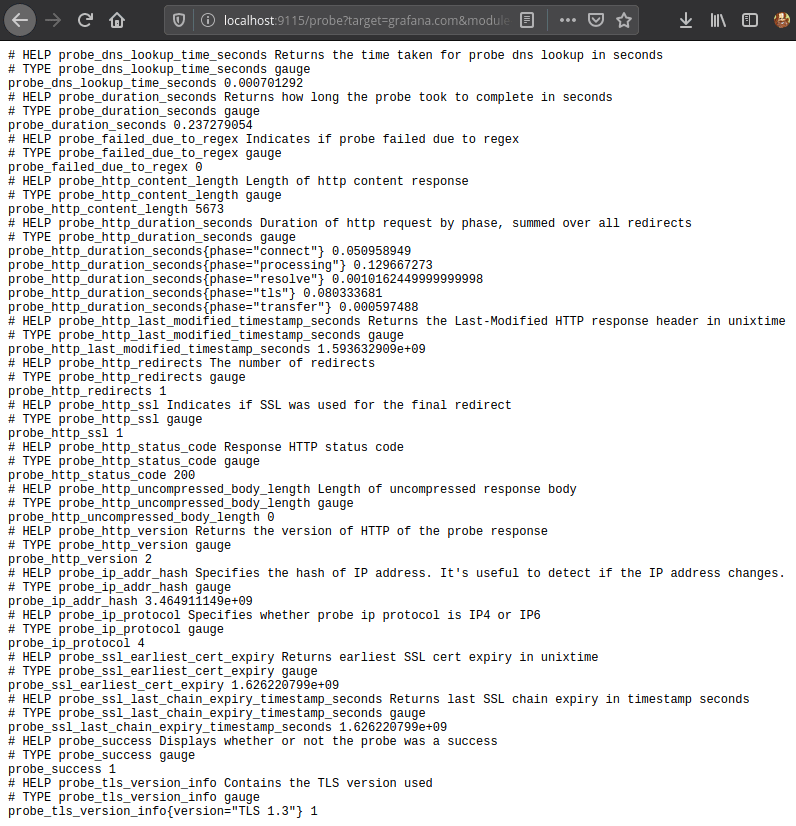
Notice the probe_success 1 near the bottom. So I know my probe worked!
It’s also reflected back on the main page:
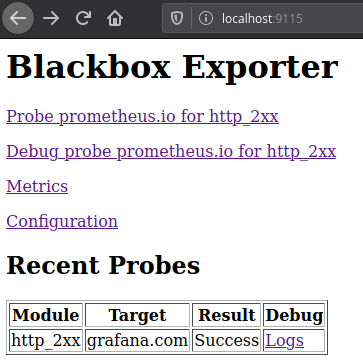
Next up, I’ll add the scrape config to my Agent, so that this probe is executed regularly.
server:
  log_level: info
prometheus:
  wal_directory: /tmp/wal
  global:
    scrape_interval: 15s
  configs:
    - name: agent
      host_filter: false
      scrape_configs:
        - job_name: 'blackbox'
          metrics_path: /probe
          params:
            module: [http_2xx]  # Look for a HTTP 200 response.
          static_configs:
            - targets:
              - grafana.com    # Target to probe with http.
          relabel_configs:
            - source_labels: [__address__]
              target_label: __param_target
            - source_labels: [__param_target]
              target_label: instance
            - target_label: __address__
              replacement: 127.0.0.1:9115  # The blackbox exporter's real hostname:port.
      remote_write:
        - url: https://prometheus-us-central1.grafana.net/api/prom/push
          basic_auth:
            username: <your-username>
            password: <your-password>
integrations:
  agent:
    enabled: true
  node_exporter:
    enabled: true

  prometheus_remote_write:
   - url: https://prometheus-us-central1.grafana.net/api/prom/push
     basic_auth:
       username: <your-username>
       password: <your-password>
Note: Currently you have to add the remote_write section in both places, but this will change in a future release.
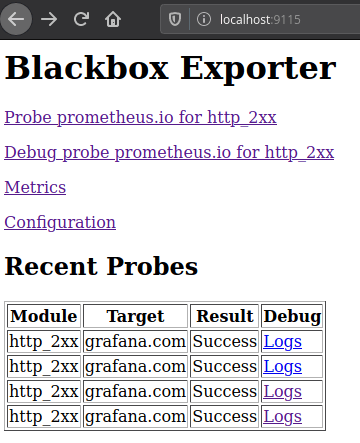
After restarting my agent process, I can see the probe is being repeatedly executed:
Finally, I import the Blackbox Exporter Quick Overview dashboard, and here we are:
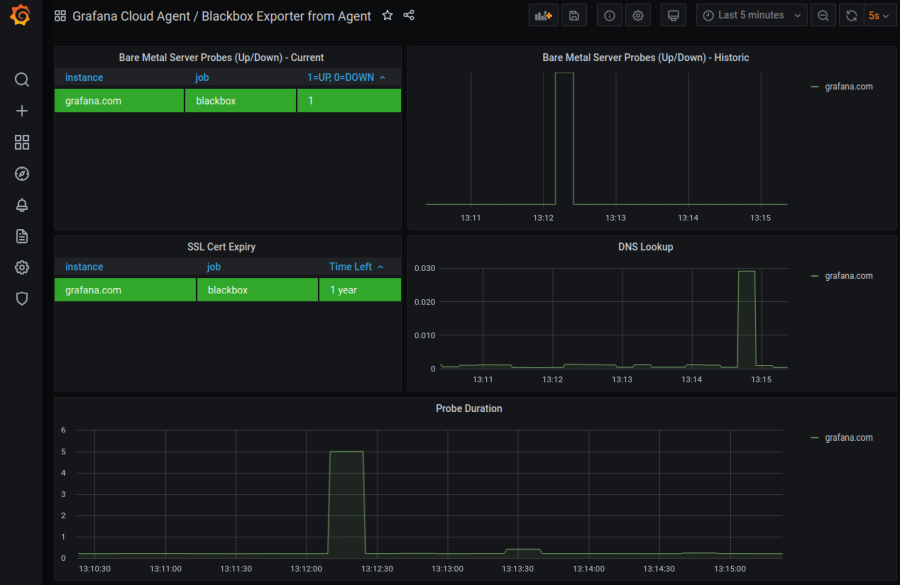
I’d like to point out the difference here between an Agent integration and a manual setup. Notice how much less work it was configuring the node_exporter compared to the blackbox_exporter. This is the purpose of integrations: to make common configurations much simpler to implement and bundle within the Agent itself.
As I mentioned before, the Agent will have more integrations added in future, so look out for improvements!
Conclusion
So to recap:
The Grafana Agent makes it easy to have a Prometheus-like config for obtaining/scraping/sending metrics without needing a full Prometheus server.
It has two built-in integrations that automate setup and configuration of
agentmetrics andnode_exportermetrics.All the usual manual scrape configs you are familiar with from Prometheus can still be used in conjunction with integrations; this blog example used
blackbox_exporter.More integrations are coming!
Here are some Agent-related resources:
That’s it for now! Look out for further posts on the Grafana Agent where we’ll try out some more advanced setups!
Cheers.
Thanks to Robert and Eldin for assisting with/reviewing this post and keeping me honest. :)


