Learn Grafana: How to automatically repeat rows and panels in dynamic dashboards
Running your software on dynamic infrastructure means that your monitoring platform needs to change dynamically.
Variables let you reuse a single dashboard for all your services. Select the service you want to inspect from a drop-down menu, and watch panels update to only show you metrics from that service.
Grafana lets you create dynamic dashboards using template variables. Any variables in your queries interpolate the current value of the variable before the query is sent to the database.
While you can create a custom variable that lets you manually define the available values, the power of template variables comes from being able to query your data sources to dynamically update the values based on, for example, host names for all nodes in a cluster.
A common use case for variables is to filter data within a panel. In this blog post — which is part of our Learn Grafana series that covers how to build effective and efficient dashboards — we’ll look at how you can dynamically add and remove entire panels through a feature called repeated panels.
How to repeat panels
If you have at least one variable defined for your dashboard, then you can configure a panel to repeat for every selected value in that variable. When the values in the variable change, so does your dashboard. Neat!
Before you can enable repeated panels, though, you need to create a variable. Let’s create a variable that will hold a set of instances. If you already have a dashboard with one or more variables, you can skip this part.
- Create a new, blank dashboard.
- Go to Dashboard settings by clicking the cog icon in the top-right corner.
- Go to the Variables tab and click Add variable
- In Name, enter instance. This is what you’ll be referring to in your queries.
- In Type, select Custom. Custom variables let us manually add values to our variables, which will be useful for testing.
- In Values separated by a comma, enter
web1, web2, web3, backend1, backend2. - Under Selection options, enable Multi-value and Include All option.
- At the bottom of the page, click Add.
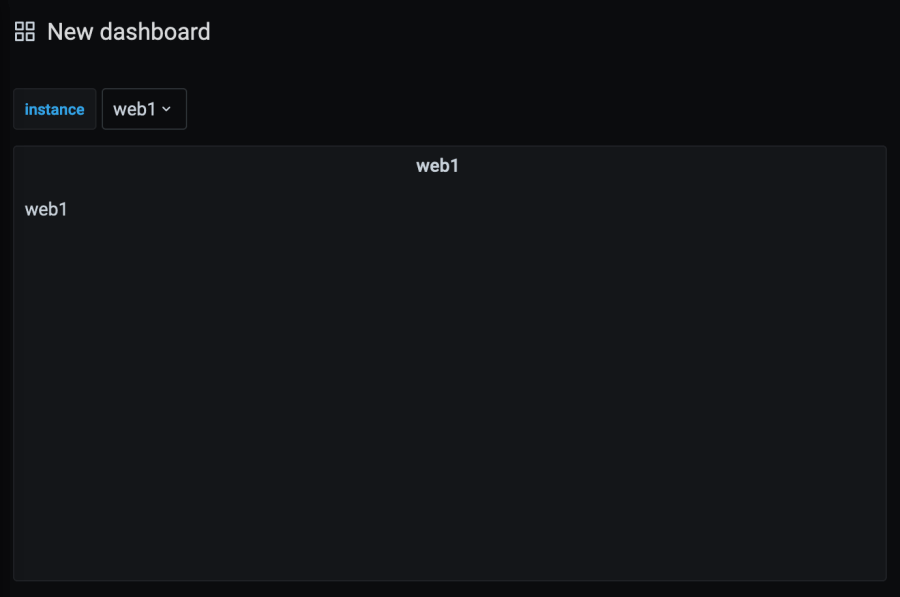
- Click the arrow in the top-left corner to go back to the dashboard. In the top-left corner of the dashboard, there’s now a drop-down menu that contains the values you just defined.
There. You’ve created a variable, but you’re not using it yet. Next, let’s create a panel that uses the variable you just created.
- Add a panel, and then select the Text visualization.
- Select Markdown mode, and then replace the sample text with
$instance. - Under Settings, change Panel title to
$instance. This sets the title of each repeated panel to the instance name. - Click Apply to go back to the dashboard.

Try selecting a different instance from the instance drop-down menu. The panel shows the value of the variable inside the text panel and in the panel title. If you select multiple values, then the panel displays something like web1 + web2, depending on the values you selected.
By changing the value of the variable, you can dynamically change the content of the panel. This is already quite useful, but we’re not finished yet! Next, you’ll configure the panel to repeat for each selected instance.
- Edit the panel by clicking the title of the panel, and click Edit.
- In the panel editor, open the Repeat options section under Panel options.
- In Repeat by variable, select the instance variable.
- In Repeat direction, select Horizontal to lay out the repeated panels horizontally.
- Apply your changes to go back to the dashboard.
Now, as you change your selection from the drop-down menu, panels appear and disappear accordingly. You can even select All to create a panel for every instance.
Since repeated panels are based on the original panel, to edit the repeated panels you need to edit the original panel — all repeated panels are updated after you reload the page. No matter how many panels you end up with, you can change all of them in one place.
Repeated panels are useful to avoid having to manually create near-identical panels. But what if you want to repeat a set of panels for every selected value?
How to repeat rows
We’ve seen how we can dynamically create panels from variables. Next, we’ll see how to dynamically add entire rows of panels! Repeated rows allow you to dynamically create whole groups of panels.
Imagine you want to create a RED dashboard. For each service you’d like three panels displaying traffic, number of errors, and how long requests are taking. We could create repeated panels for each of these metrics, but ideally we’d like to group the panels for each service.
Let’s look at how you can repeat sets of panels using repeated rows.
For this example, let’s create another custom variable called service, containing order-api, auth-api, billing-api. Follow the same steps as when you added the instance variable. I’ll wait for you.
Done? Perfect. Now, let’s create a repeated row:
- Click Add panel, and then click Add new row. The panels you created earlier are automatically assigned to the row you created.
- Hover your cursor over the Row title and click the gear icon to open the Row options.
- In Title, enter
$service. - In Repeat for, select the variable you want to repeat rows for. For this example, select service.
- Click Update.
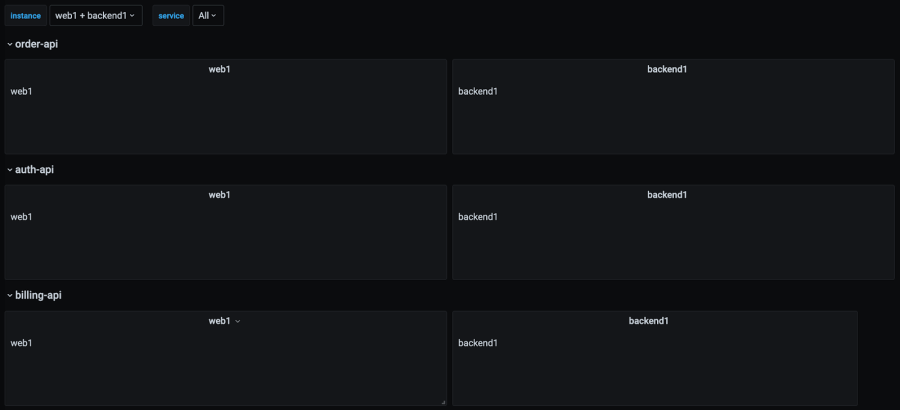
- Select multiple services from the service drop-down menu. Grafana creates a row for each selected service, each within its own set of repeated panels.
- Find the left-most panel in the top-most row and edit it.
- In the text area for the Text panel, enter
$instance and $service. - Save the dashboard and refresh the page.
We’re using the Text panel here so you can see the values of the instance and service variables available to each repeated panel. In practice, though, you’d use the variables in your queries to make each panel display data for a given instance and service.

Pitfalls when repeating panels
While I understand the temptation to create repeated panels for all of your 300 production instances, using repeated panels isn’t an excuse to deviate from good dashboard design.
For one thing, each repeated panel sends a separate query to your data source. This can get expensive quickly!
For these reasons, avoid repeating panels for highly changeable variables, such as pod names in Kubernetes. Instead, use repeated panels for things like states, priority, or machine types.
In this blog post, we’ve seen how to create repeated panels and rows, two useful features to avoid maintaining duplicated panels across your Grafana dashboards. For more information, check out the documentation for repeated panels.
Learn more
To make the most out of using Grafana, check out these other easy-to-follow guides in my Learn Grafana series:
- How to build a scatter plot plugin in Grafana 7.0
- How to use dual axis graphs
- Share query results between panels to reduce load time
Grafana Cloud is the easiest way to get started with dashboards, metrics, logs, and traces. We have a generous free forever tier and plans for every use case. Sign up for free now!


