How Hiya migrated to Grafana Cloud to cut costs and gain control over its metrics
Last year, when a company that works with several of the world’s top carriers, OEMs, and enterprises to provide caller identity and spam blocking services for more than 120 million users needed to make changes to their monitoring service, Grafana Labs got the call.
Hiya was founded in 2016, and from the start was a container-centric Kubernetes shop. “Having a technology suite that embraces containerization is critical for us,” says Senior Software Engineer Jake Utley, a member of Hiya’s Core Technologies team.
A little more than two years ago, a group of engineers had begun using Prometheus while the rest of the company still relied on a vendor product for monitoring. This group had initially made the switch because they were responsible for a lot of Hiya’s metrics, and they’d been having trouble maintaining costs with the current vendor product.
Cut to 2019. The engineers were very satisfied with Prometheus, and they were growing frustrated with the service the rest of the company was still using. “We continued to see that we didn’t have the control over the metrics that we wanted with our existing solution,” Utley says. “We wanted tools that would enable us to either filter or aggregate metrics, which would allow us to maintain a smaller set of them. Without that, we were forced to ingest everything, whether we used it or not.”
It was time to make a company-wide switch.
Paging Grafana Labs
Hiya chose Grafana Labs’ Grafana Cloud Hosted Prometheus for a few reasons. First of all, Utley says, they considered the Prometheus and Grafana combination the industry standard when it comes to monitoring Kubernetes clusters and containers.
They also liked that Prometheus provided them with a level of control and transparency that they didn’t have with their other service. “We wanted the ability to look at our own information and understand it from top to bottom,” says Senior Software Engineer Dan Sabath.
Compared to other primary metrics collectors, Utley liked that you can query the local Prometheus directly. “You can use sophisticated remote write rules in order to filter or mutate metrics as they get shipped from Prometheus into the external system,” he says. “Having that level of control was something that we really wanted. Without it, we have to go to our engineering teams – who are already busy – and ask them to make all of these little changes in their applications. As a central engineering team within the organization, we want to control these changes and avoid micromanaging the other teams.”
But since they would be sending out their metrics from Prometheus to another system, the big question for Hiya became, “Where do we go from there?”
In order to scale Prometheus, Utley says, they considered running either Cortex or Thanos (both open source projects for horizontally scalable Prometheus-compatible monitoring systems) in-house or using other providers, but they concluded that Grafana Cloud was “the most in line with what we wanted to accomplish.”
Indeed, for Hiya, one of the key selling points was the fact that Grafana Cloud is powered by Cortex. “We can stick to open source tools, we can do deep code audits when we need to, and we can rely on the community,” Utley explains. Plus, he says, “We do not have to concern ourselves with managing and understanding all of the infrastructures.”
The Hiya team was also attracted to some of Cortex’s key features: having one place to go that has all the data, being able to de-duplicate redundant copies of data, and being able to have an arbitrary timeline of data.
But the real game-changer was the fact that Cortex “provides the missing element in most Prometheus deployments, a single pane of glass operational view across many clusters and regions,” says Sabath.
Before, Hiya had been operating with an HA pair – a standard move with Prometheus – which meant that every time they ran a query, it could come back with different results depending on which Prometheus it hits. “We had a limited timeline, all our data was on disk, and we had to query many Prometheuses, which is annoying,” Utley says.
Both Thanos and Cortex had solutions for that, and Utley thought Thanos seemed easier to run, making it the original front-runner for Hiya. However, Utley changed his mind when he dug deeper into how Cortex works: “It’s built to handle massive scale, whereas Thanos is built to be a layer on top of an existing set of Prometheuses. If we are going to ship our data to an external provider, we would much rather use Cortex.”
The 411 on implementation
Hiya faced two big challenges during the implementation phase: The biggest was moving years’ worth of dashboards, alerts, metrics, legacy services, and legacy dashboards from their previous provider to Prometheus. Writing automation to move the initial dashboarding was a major part of why Hiya was able to complete the migration to Grafana Cloud in one quarter.
The other issue was with cron job metrics. Previously, there had been a very direct integration that allowed for all of Hiya’s Kubernetes cron jobs to be implemented in a way so they were directly sending their end-of-job metrics to the service provider. For most of the non-cron job services, Hiya used the Prometheus endpoints and let the previous company scrape that.
Some work was required to make things run smoothly within the Prometheus paradigm. “We solved that by using the Prometheus Pushgateway to tie those metrics back into the standard set of tools,” Utley explains.
Some of Hiya’s teams also struggled as they moved from a web-based, point-and-click service to one that uses PromQL. “Grafana has a lot of little features to help it make it easier to write Prometheus queries,” Utley says, but a lot of training sessions, hands-on debugging, hand-holding, and Slack messaging were still required as teams learned to understand the differences in PromQL and figured out why they were seeing what they were seeing.
Additionally, Hiya initially had issues with the alerting options. They’d had a benchmark set with their old Prometheus alerts, and their new Grafana alerts weren’t meeting their requirements.
Thanks to support from the Grafana Labs team, they were able to solve the problem by getting early access to the Cortex Ruler and Hosted Alertmanager service that Grafana offers. “That allows us to use Prometheus Alerting, which is really nice,” Utley says. Still, because the service was new, it wasn’t flawless. “As a result, we worked with a Grafana Labs engineer who works on Cortex in order to tune the product to meet our needs. That was a very hands-on relationship, which was much appreciated.”
Hold for results
Hiya’s switch to Grafana Cloud has paid off in a number of ways.
Jorge Barrios, the Engineering Manager for the Core Technologies team, says the company is “saving a substantial amount of money” compared to what they were spending before, with Sabath adding that they now have “a deep understanding of what metrics we are actually being billed on.”

Hiya is taking advantage of the things they can do in Prometheus in order to get that insight. “We can audit our data to see which metrics have the highest cardinality,” Utley says, “or to see which services are publishing the most metric series. This gives us an opportunity to know where to filter out metrics for the highest impact. These audits can be done either with PromQL or using the Prometheus APIs to get a complete dump of every single metric in the system. We have wanted this level of visibility for years, and have never had it until now.”
As a result, they’ve filtered out some very simple metrics that are almost never used, and Utley has done audits to look for potential future savings. “If services publish their latencies in terms of six different percentiles, we may only need three of them,” he says. “Or we can write rules for high-cardinality metrics to remove per-pod granularity. These types of changes usually lead to significant savings.”
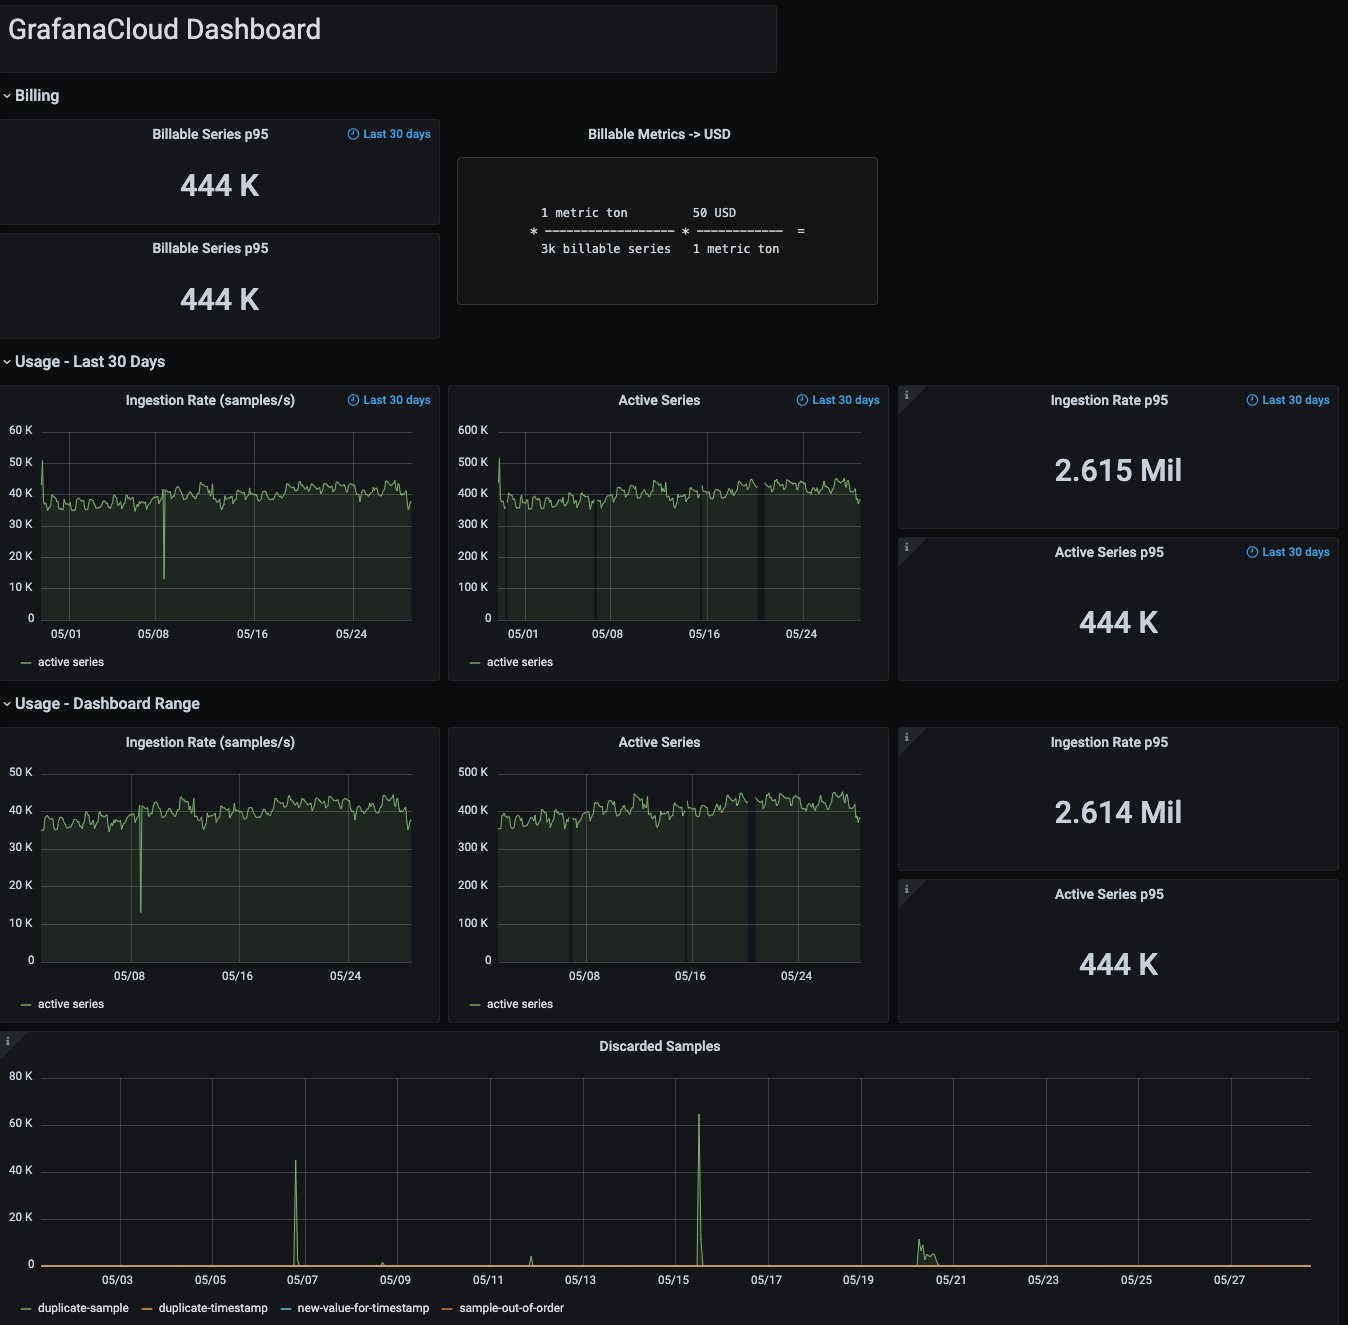
Once fully onboarded onto Grafana, Hiya had about 560,000 active series in Grafana Cloud. Since then, they have been able to reduce their metric count to about 400,000 active series.
Dialing into dashboards
Hiya’s engineering teams have had a great experience with their Grafana Cloud dashboards.

“A number of engineers have been excited to share the dashboards they created,” says Utley. The pie charts plugin is a favorite of many teams; they also make a lot of use of text panels. It’s a feature that was available in their previous service, but one they rarely used.
“It’s a simple feature that has amazing outcomes,” Utley notes. By being able to explain what graphs are, what they mean, and why they matter, it makes things less confusing for people who aren’t experts at reading graphs.
The Core Technologies team responds to a lot of operational alerts, so Barrios says the text feature also comes in handy if he’s on call and doesn’t have a very deep understanding of another team’s systems: “Looking at their graphs to see if their services are operating correctly, and having that constant context available right there is very useful.”
Phoning ahead
Going forward, Sabath says he hopes to add standardized dashboards to Hiya’s basic deployment framework.
Utley is also looking forward to using the upcoming Grafana feature supporting visualizations that are nested inside of tables. “I want to have a clean list of all our Kubernetes clusters that shows a high-level overview of each cluster’s health,” says Utley. “Having a proper visualization instead of just a number will be super exciting.”
Ultimately, going with Grafana Cloud has been a smart call for Hiya. “We have been impressed with Prometheus and Grafana as open source tools for a long time,” says Utley, “and now we have a hosted service that builds on top of that.”


