GrafanaCONline Day 7 recap: The past, present and future of Loki, and making dashboards that tell stories
GrafanaCONline is live! We hope you’re able to check out all of our great online sessions.
If you aren’t up-to-date on the presentations, here’s what you missed on day 7 of the conference:
The future (and past and present) of Loki
In a perfect follow-up to the release of Loki v1.5.0, Loki tech lead Ed Welch and Loki maintainer Cyril Tovena teamed up for a presentation about the history of the project, what’s new right now, and what’s next – including query parallelization testing of 40GBs/s and an expansion of the LogQL query language.

Check out their presentation here.
Storytelling through dashboards
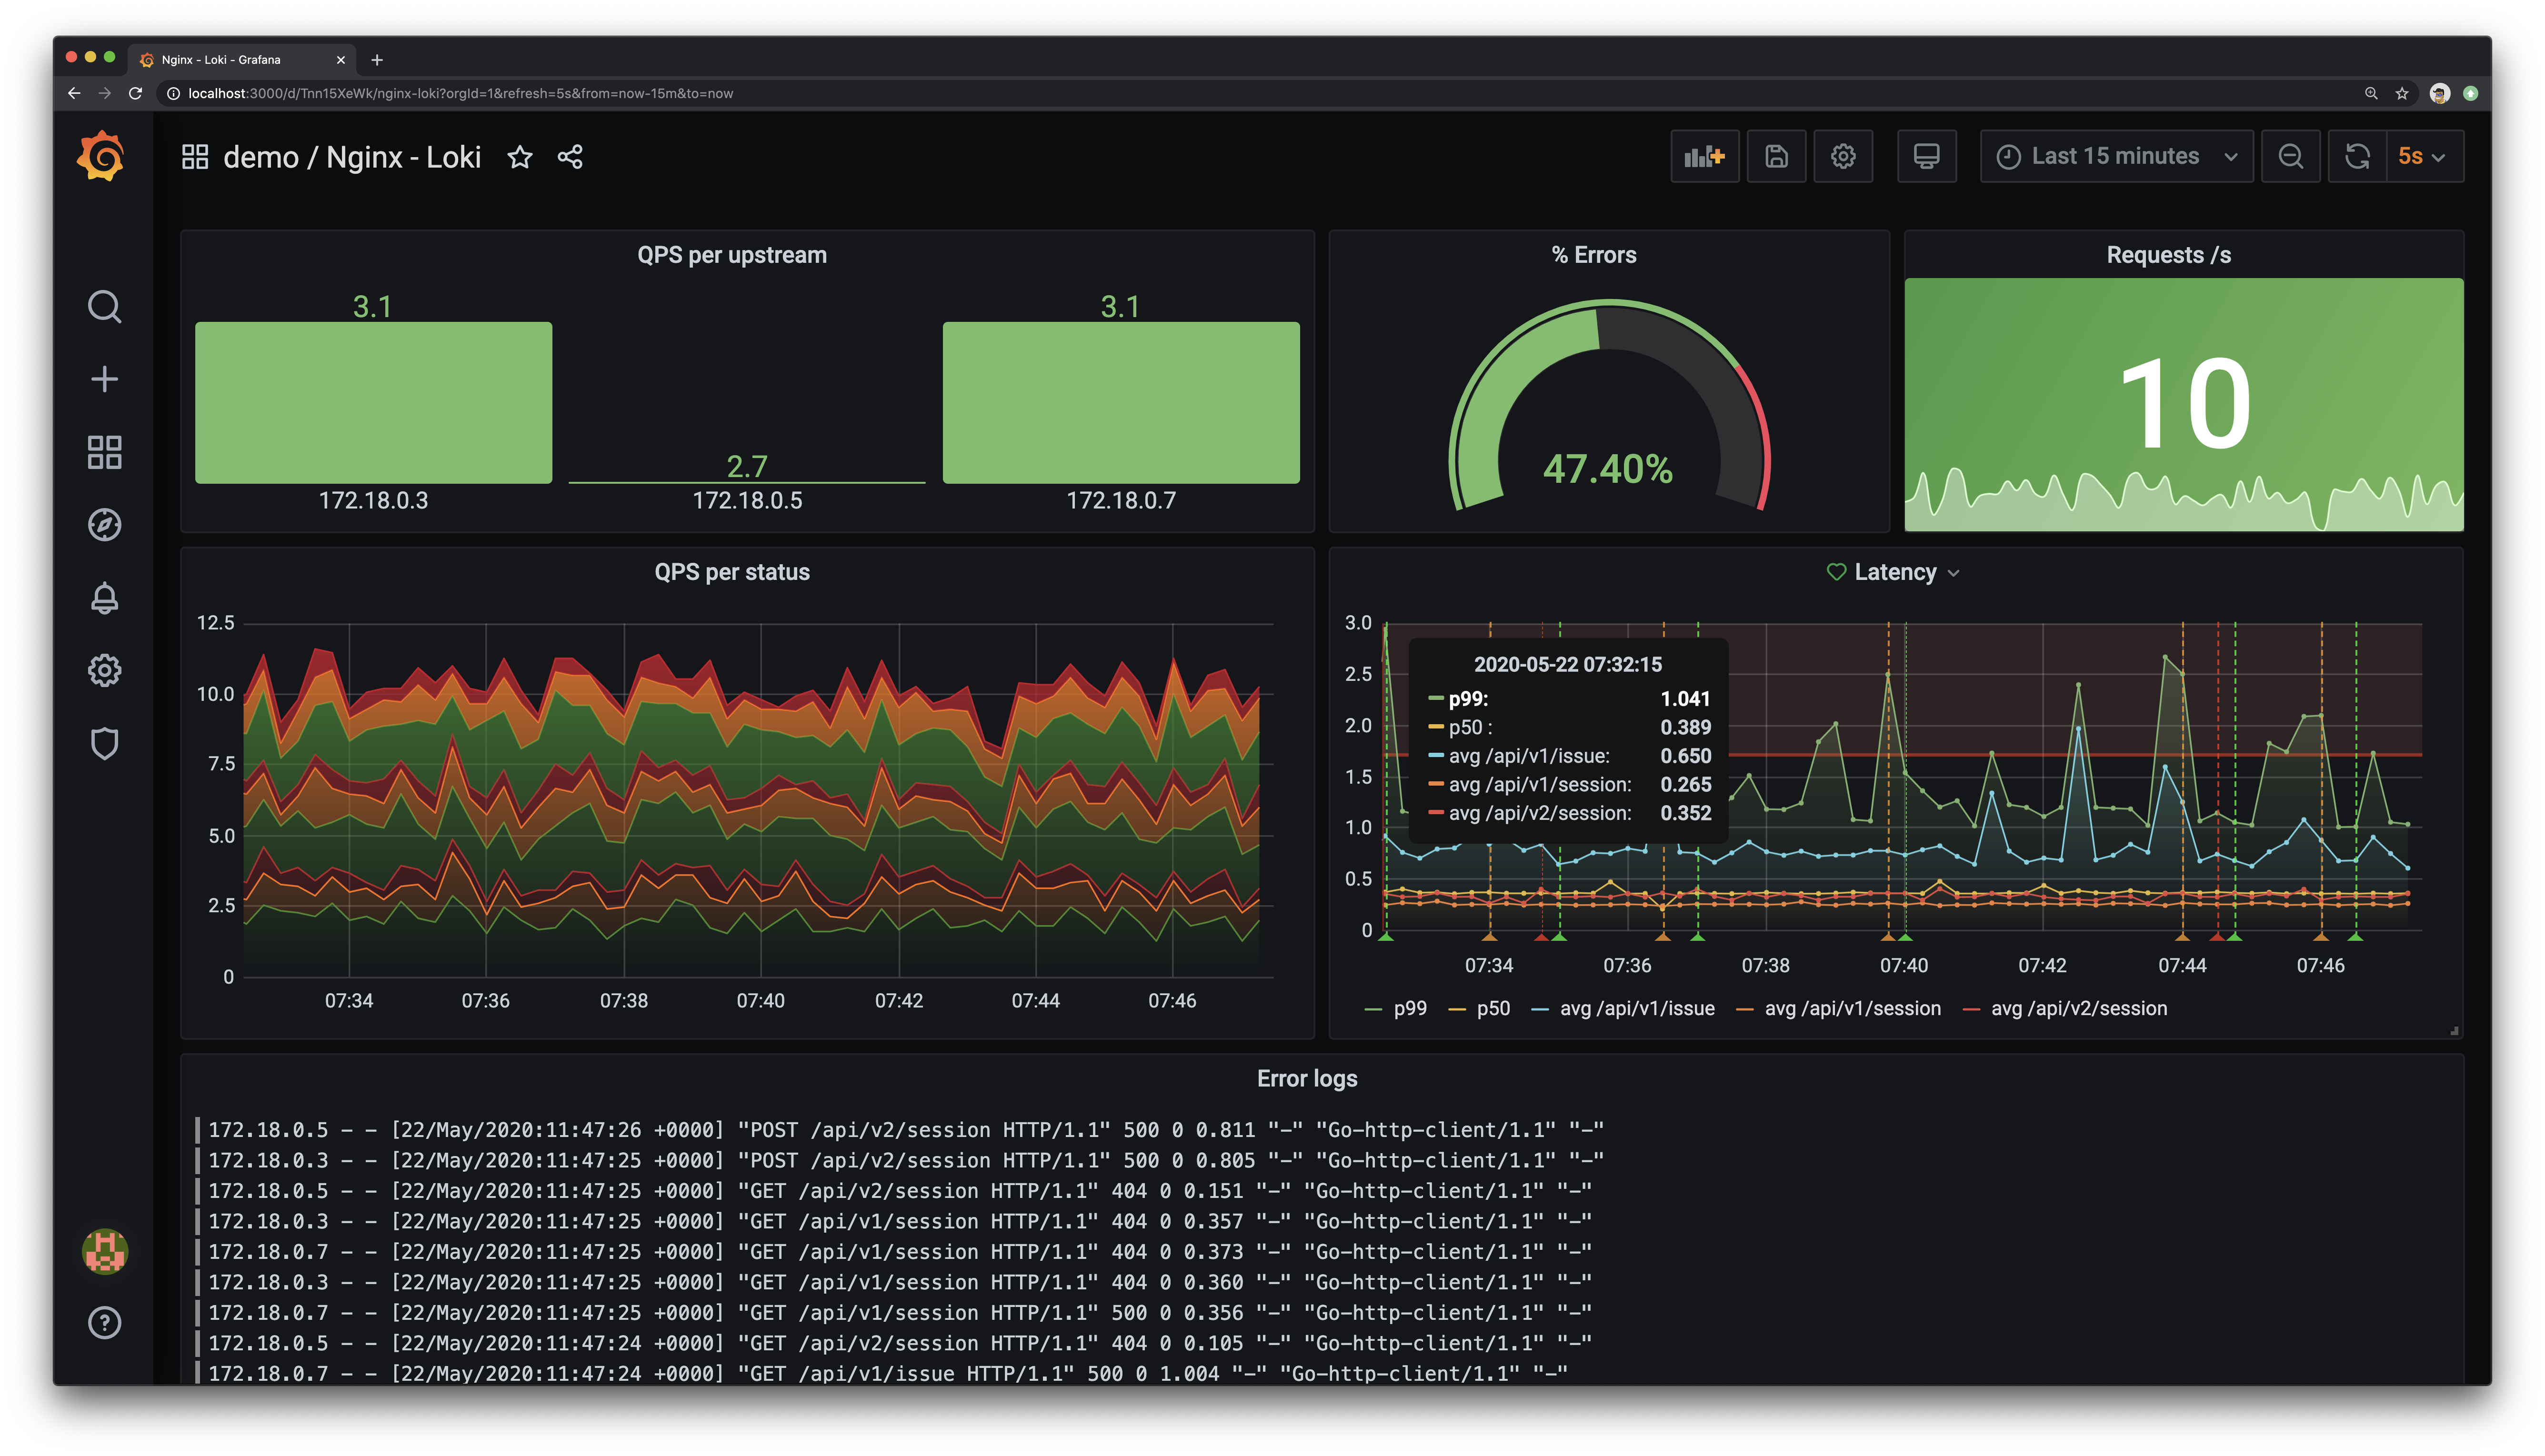
Julien Pivotto, an open source consultant at Inuits and a Prometheus maintainer, discussed the power of graph representations in Grafana. He emphasized the importance of making dashboards that tell stories and can be read by many different people. He then shared tips on how to visualize different situations and make them easy to read by using advanced features in Grafana.

Watch the full talk here.
Week 3 kicks off on Tuesday with these sessions
-Grafana plugins with Grafana Labs software engineer Dominik Prokop
-Chrome browsing data to Grafana — as you browse with supervisor.com CTO Matti Paksula
Don’t forget that you can connect with the Grafana community and get the latest updates from the Grafana Labs team during the event on Slack. Sign up here and join the #grafanaconline channel.
See the full schedule here.


