GrafanaCONline Day 6 recap: The power of Tanka, and a peek into the world of beehive monitoring with Grafana dashboards
GrafanaCONline is live! We hope you’re able to catch the great online sessions we have planned.
If you aren’t up-to-date on the presentations, here’s what you missed on day 6 of the conference:
The power of Tanka
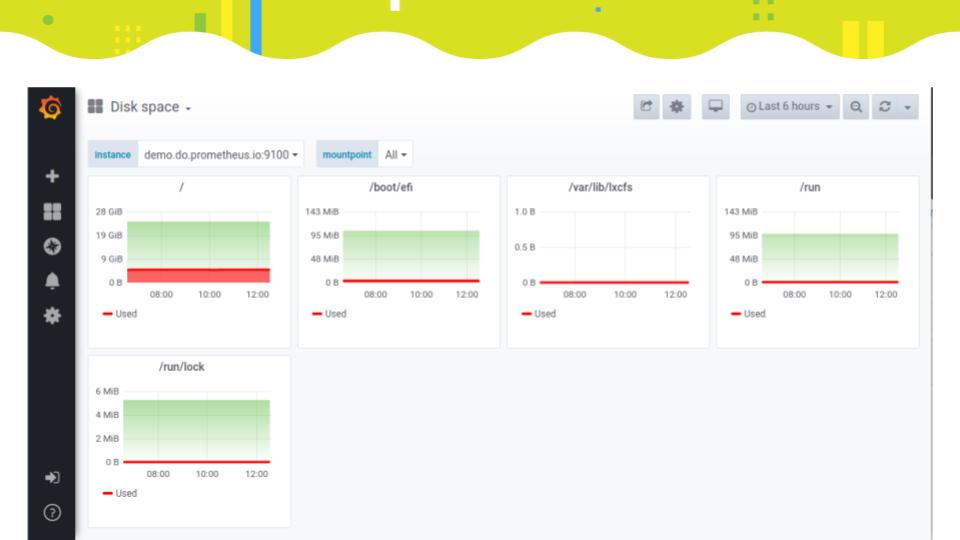
Want to see a Grafana dashboard deployed with just five lines of code? That’s one of the highlights of Grafana Labs software engineer Malcolm Holmes’ session about Tanka, a powerful tool for managing Kubernetes resources using the Jsonnet language. His presentation also includes an explanation of the benefits of deploying your dashboards alongside your code, a discussion of how to manage Kubernetes resources using Tanka and Jsonnet, and more.

Watch the full presentation here.
Beekeeper buzz
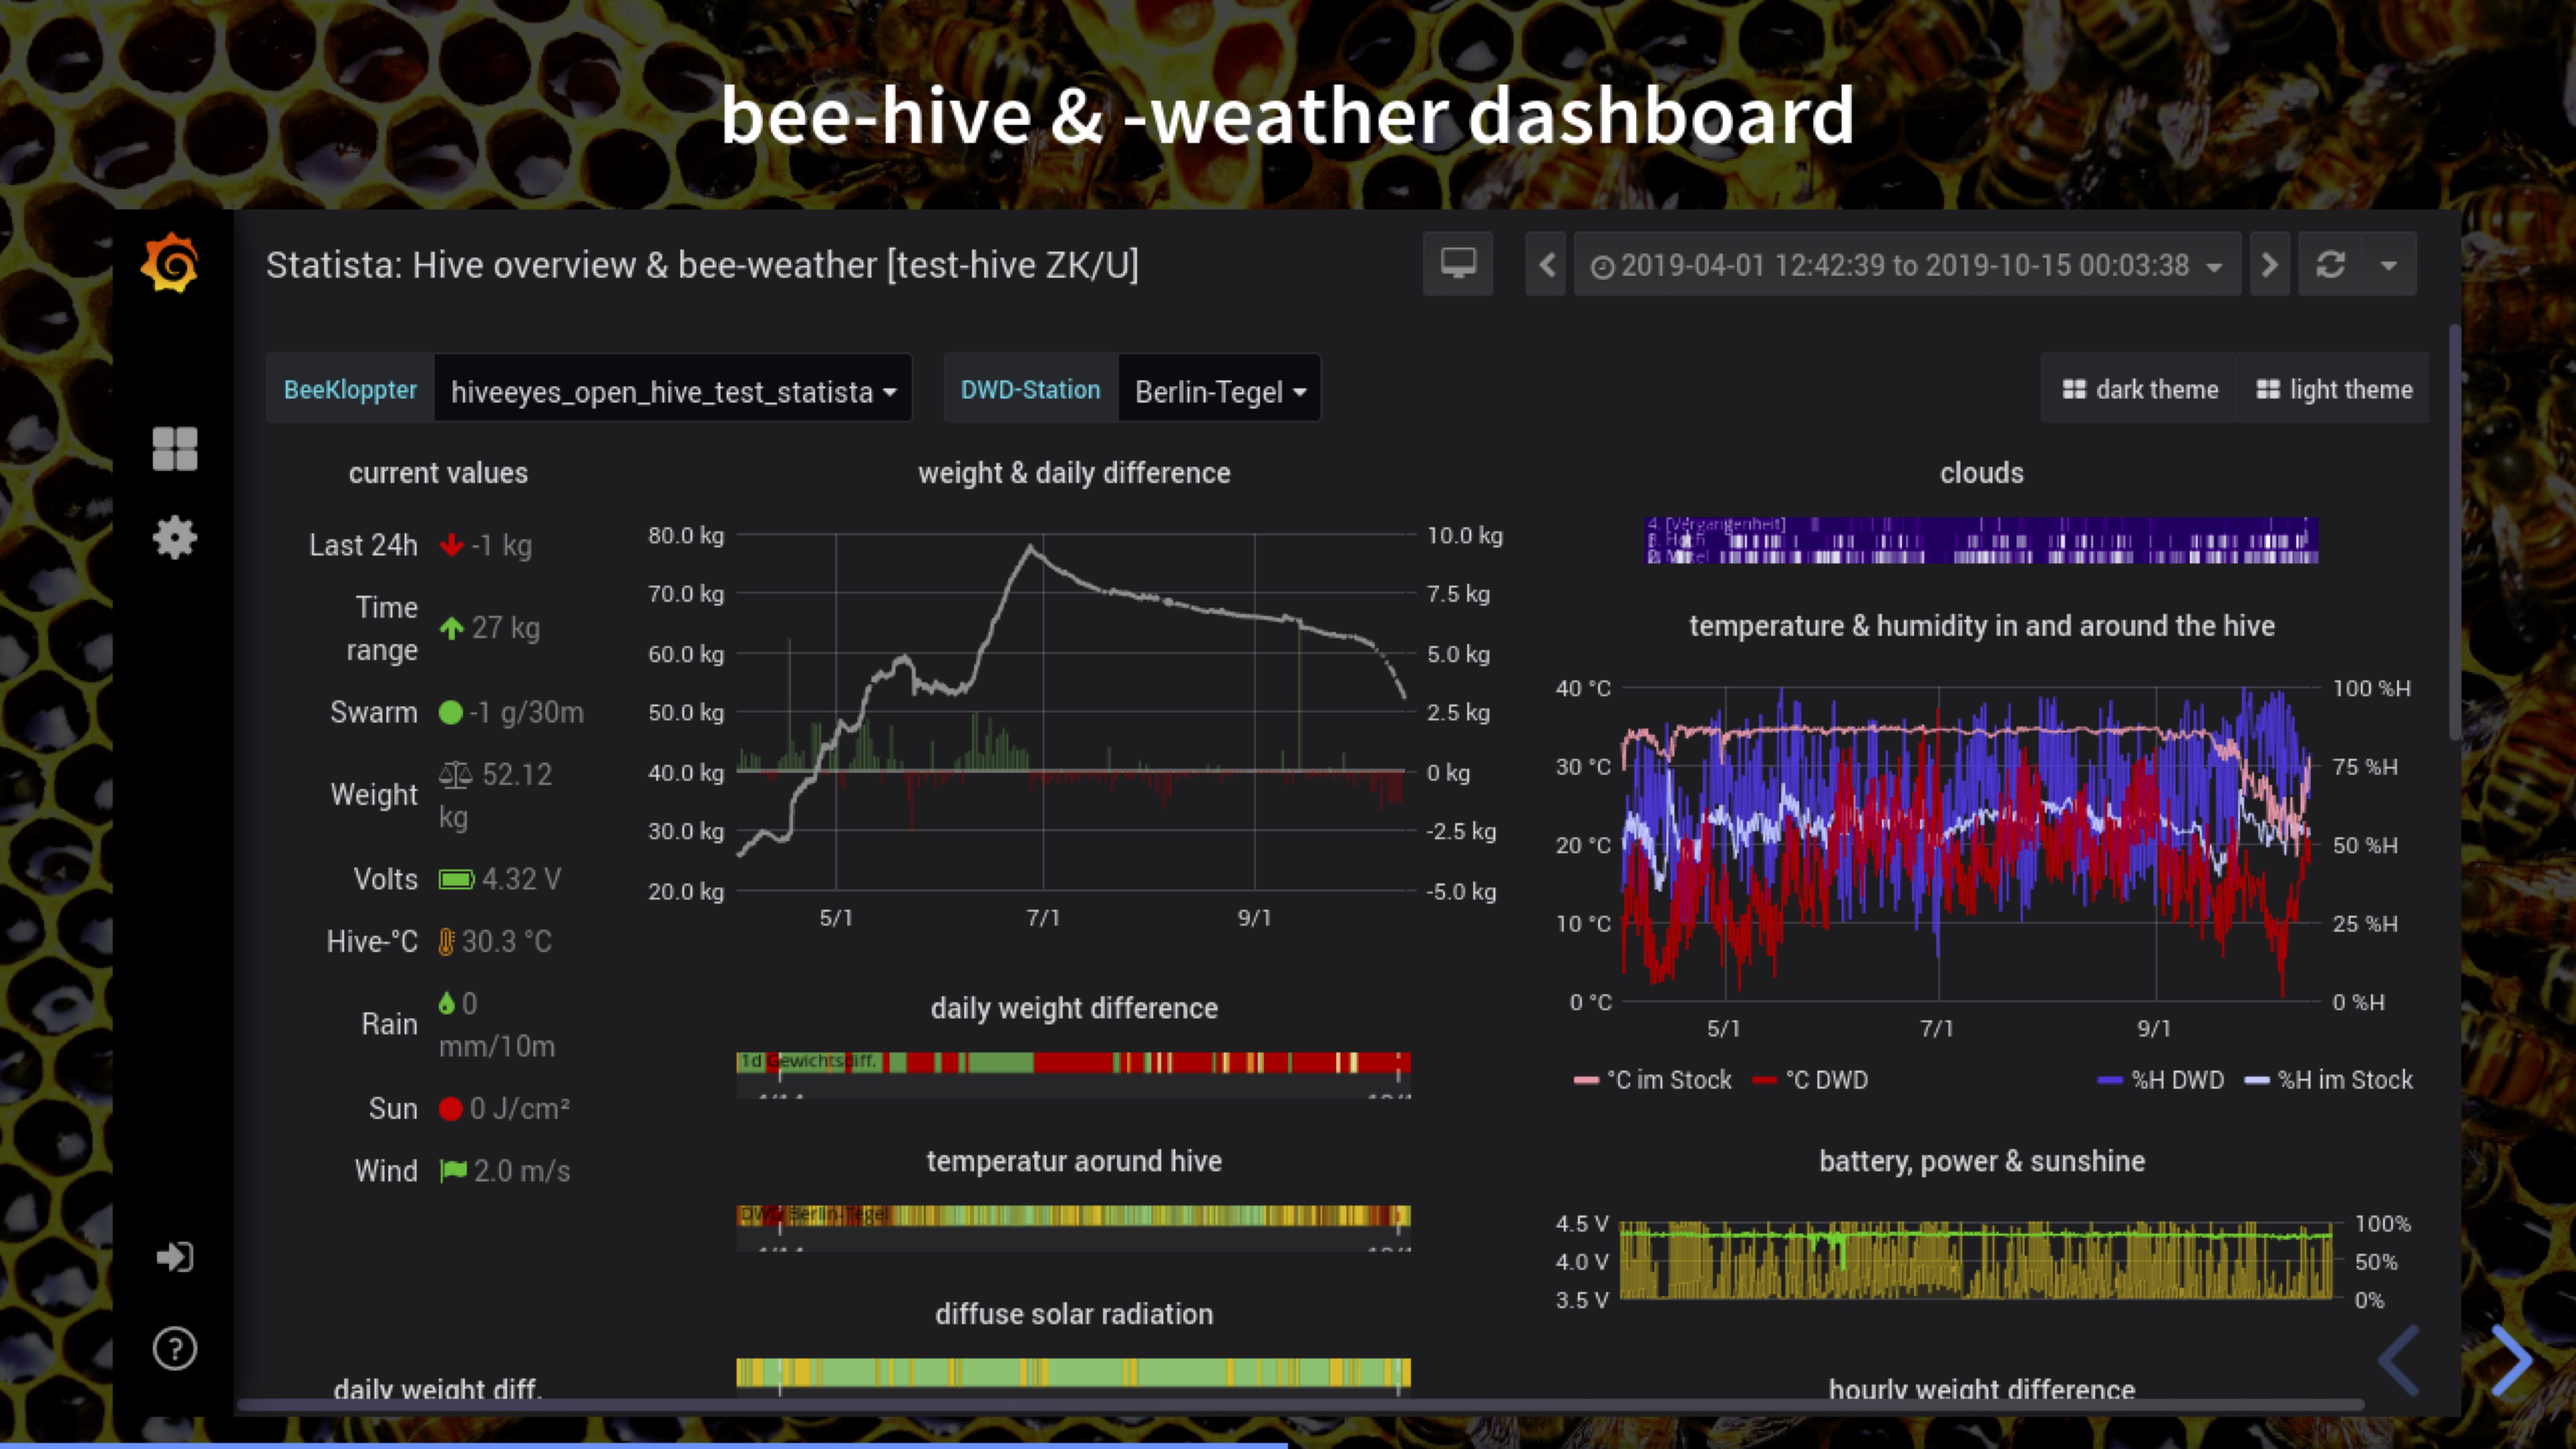
Matthias Mehldau, Data Artist at The Hiveeyes Project, revealed how Grafana dashboards help beekeepers monitor hives, weather records and forecasts. He also discussed using dashboards to compare particulate matter (PM) sensor measurements from different networks, and developing a correction dashboard to compensate for low-cost humidity sensors.

Check out the talk on demand here.
Today’s sessions
-Loki Future with Grafana Labs Senior Software Engineers Ed Welch and Cyril Tovena
-Powerful graph representations in Grafana with Julien Pivotto
Don’t forget that you can connect with the Grafana community and get the latest updates from the Grafana Labs team during the event on Slack. Sign up here and join the #grafanaconline channel.
See the full schedule here.


