How ML6 used Grafana to deliver a 200% ROI for Accolade Wines
Did you know that Grafana pairs well with a fine wine?
That’s what machine learning company ML6 discovered when they worked with their client Accolade Wines, an award-winning Australian vintner whose goal was to decrease the waste produced in its global operations.
“Accolade Wines is really focused on being as efficient as possible,” says Rebecca Brooke, ML6’s team leader in the U.K. “They’re always looking at minimizing their environmental impact.”
As one of the world’s largest wine makers that produces and distributes a portfolio of 50 labels to more than 80 countries worldwide, Accolade Wines was also named the Sustainable Manufacturer of the Year in 2018 and 2019. And for good reason: At one of their bottling facilities in Bristol, U.K., they prepare and cork more than 200 million liters of wine a year while only producing 0.8% waste – well below the 2% industry standard.
Still, at that scale, “that’s a lot of wine and raw materials wasted,” says Brooke. “The loss financially was about £1 million [$1.24 million] annually.”
Uncorking a solution with Grafana
Enter ML6, one of the largest machine learning companies in Western Europe, which is headquartered in Belgium with satellite offices in the U.K., the Netherlands, and Germany. Founded in 2013, ML6 employs more than 65 engineers to help companies solve critical business problems with machine learning applications such as computer vision, natural language processing, and time series modeling.
“We discovered that one of the challenges Accolade Wines had was happening on the bottling line,” says Brooke. “Each piece of equipment was manufactured by a different original equipment manufacturer [OEM], and the monitoring systems associated with each didn’t speak to each other.”
Ultimately that meant that operators couldn’t pinpoint where or when they were losing volumes of product.
“Only after one run process was completed would they be able to calculate the difference between what came in from the tanks and what’s come out in the bottles,” says Jeffrey Hagen, senior machine learning engineer at ML6. “By then, it was too late to do anything about it.”
To find out what the real blockers were in the bottling process, the ML6 team led by Hagen extracted data from various stages in the operation, such as tank volume, flow rates, filtration levels, bottles filled. They then filtered the information through Grafana.
“We created a real-time Grafana dashboard that visualizes the end-to-end process and helps identify when the wine loss occurs so operators can directly act on it,” says Hagen. For Accolade, ML6 runs Grafana on Google Cloud. (ML6 is a certified machine learning partner for Google.)

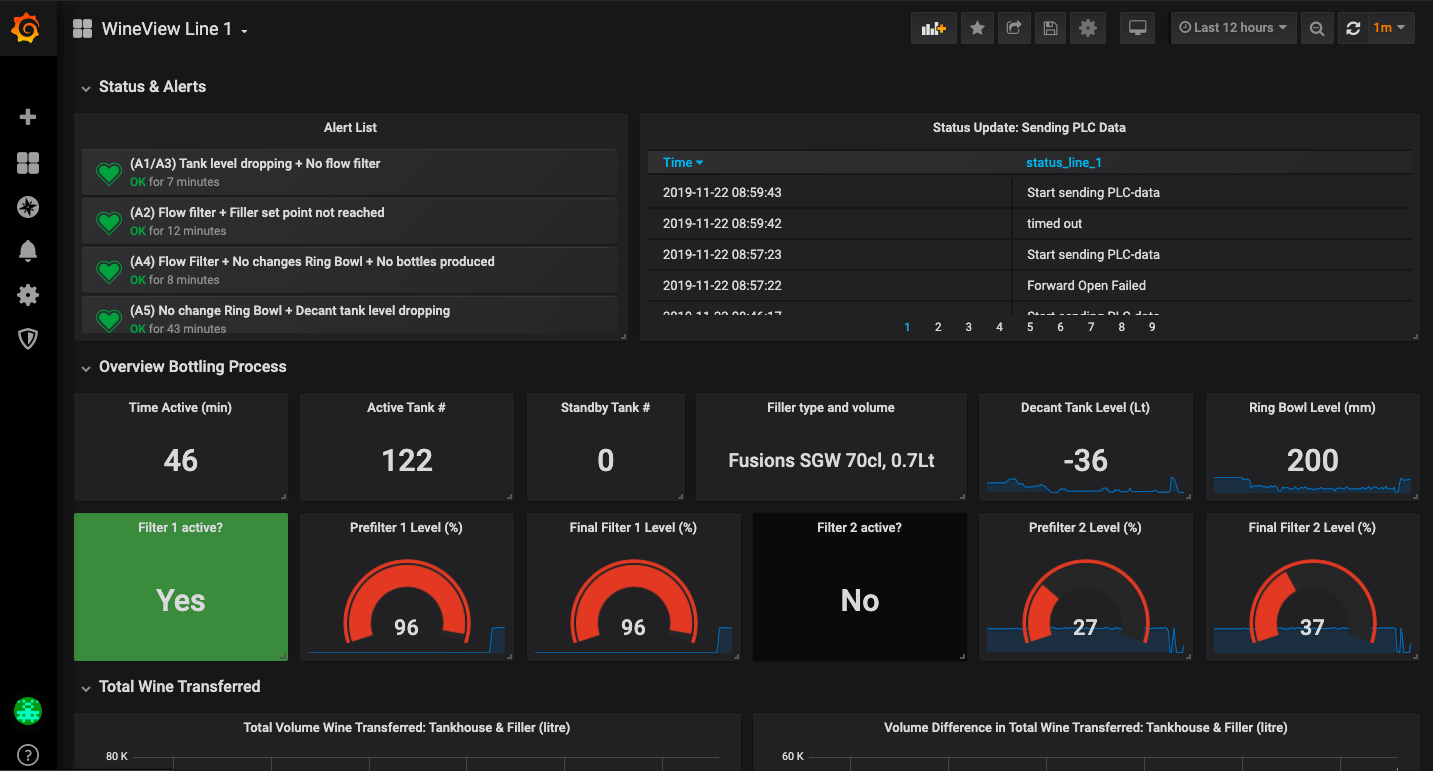
The new rule-based alert system shown in the main dashboard (above) monitors for big discrepancies in volume during the bottling process. So when there is a sizable difference in the amount of wine going in and coming out of any part of the manufacturing line, an alert is fired so that operators can investigate what’s causing the loss and make changes instantly.
For example, “if the tank level is dropping and there is no flow to a particular filter, then that would indicate a wine loss, and there would be an alert,” says Hagen.

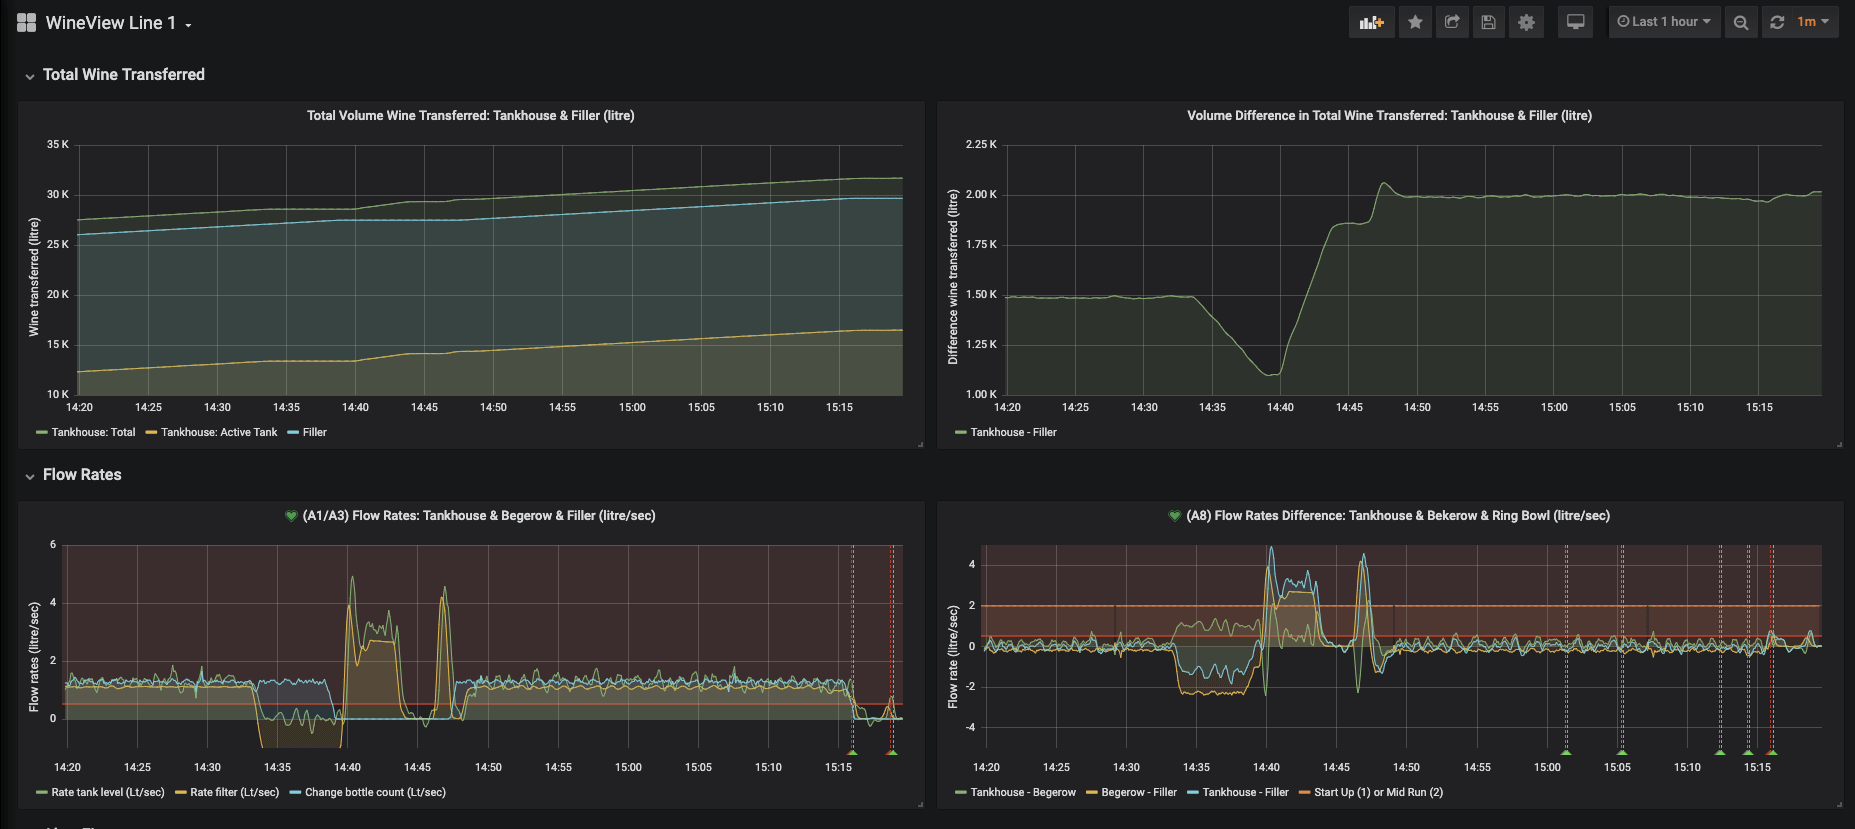
The ML6 team then mapped out information collected on a macro and a micro level. Operators can see the total wine volume in the system over time (top left) and the difference in the amount of wine that comes in and out of the facility (top right). For digging into the details, there are also graphs for flow rates (bottom) that measure the amount of liters per second that flow at certain times during the bottling process.
“Grafana was really the go-to for this,” Hagen says. “One big plus is the labeling. That is one of the things you always need to do with machine learning: you need to annotate your data.”
Also the ability to zoom in on certain details or select parts of a graph was key for Accolade Wines, which had to track multiple steps within each production line while running various production lines in parallel.
“The user interface is quite friendly so we didn’t need to do a lot of explanation for the operators about how it works,” Hagen says. “It’s quite intuitive. It’s also easy to set up and work with the queries.”
A flight of business benefits
The effects of the new monitoring system were immediate: The first phase of the project has already delivered an ROI of 200% in the first six months, reducing the company’s financial loss by an estimated £75,000 [$92,000].
On the operations level, “they previously didn’t have access to this granularity of data. Significant losses were occurring, but, because it’s a continuous process to bottle wine, going back to investigate what was happening would have been too time consuming and inefficient,” says Brooke. “Having end-to-end visualization and alerts with Grafana has been incredibly valuable to them.”
There are bigger ambitions for phase two, which is already underway. “Right now this is the wine loss that we can expect based on the experience from the operator,” says Hagen. “But there are wine losses that we don’t know about, and we can use machine learning to identify those.”
The ML6 team is currently implementing a machine learning application called clustering to match similar behavior of different parts of the production run (startup, changeover, end of run, etc.). Based on these clusters, hidden anomalies within the process can be spotted accurately.
“A machine algorithm can learn what is a normal cluster and what is an abnormal cluster. So not only can we capture the losses we know will occur. Now we can also see losses that have been unknown – and those are the loss percentages that we can really optimize,” says Hagen. “In this way, we are combining machine learning alerts with Grafana visualization, and it’s quite cool to do.”
Raise a glass to the future
ML6 already has plans to duplicate this machine learning solution for other clients. “A lot of manufacturers have this exact challenge where they’ve got various different pieces of equipment, and there’s no way of uniting the data from each machine in one visualization,” says Brooke. “I certainly think we’ll be doing a lot more to help other manufacturers with this issue.”
And in the current climate in which people are navigating life amid the COVID-19 pandemic, “we’re also focusing on the life sciences sector,” adds Brooke.
“There’s a lot of parallels between the work that we’ve done in manufacturing and other industries that is relevant to the pharmaceutical industry, in particular on the research and discovery side as well as drug manufacturing process development,” she says. “We see huge potential there.”


