
Pro tips for making the most of your Datadog metrics in Grafana with the enterprise plugin
This post has been updated to reflect changes in the availability of the Datadog data source plugin for Grafana Cloud users.
Hello again! We are Eldin and Christine — or, as our lovely editor has dubbed us, Regis and Kelly — jumping back in for another post.
This week, to highlight the big tent and community theme, we are going to write about how adding the Datadog plugin and visualizations alongside other sources (like Prometheus and Grafana Loki) helps provide a fuller picture of operations in Grafana.

Datadog is a popular monitoring and analytics platform that allows you to easily install an agent so you can get started with collecting metrics right away. Since we announced our Enterprise Datadog data source in 2018, the plugin has continued to evolve. In this blog post, we would like to show off some of our favorite features, ensuring you really can see it all in one place in no time.
Getting started
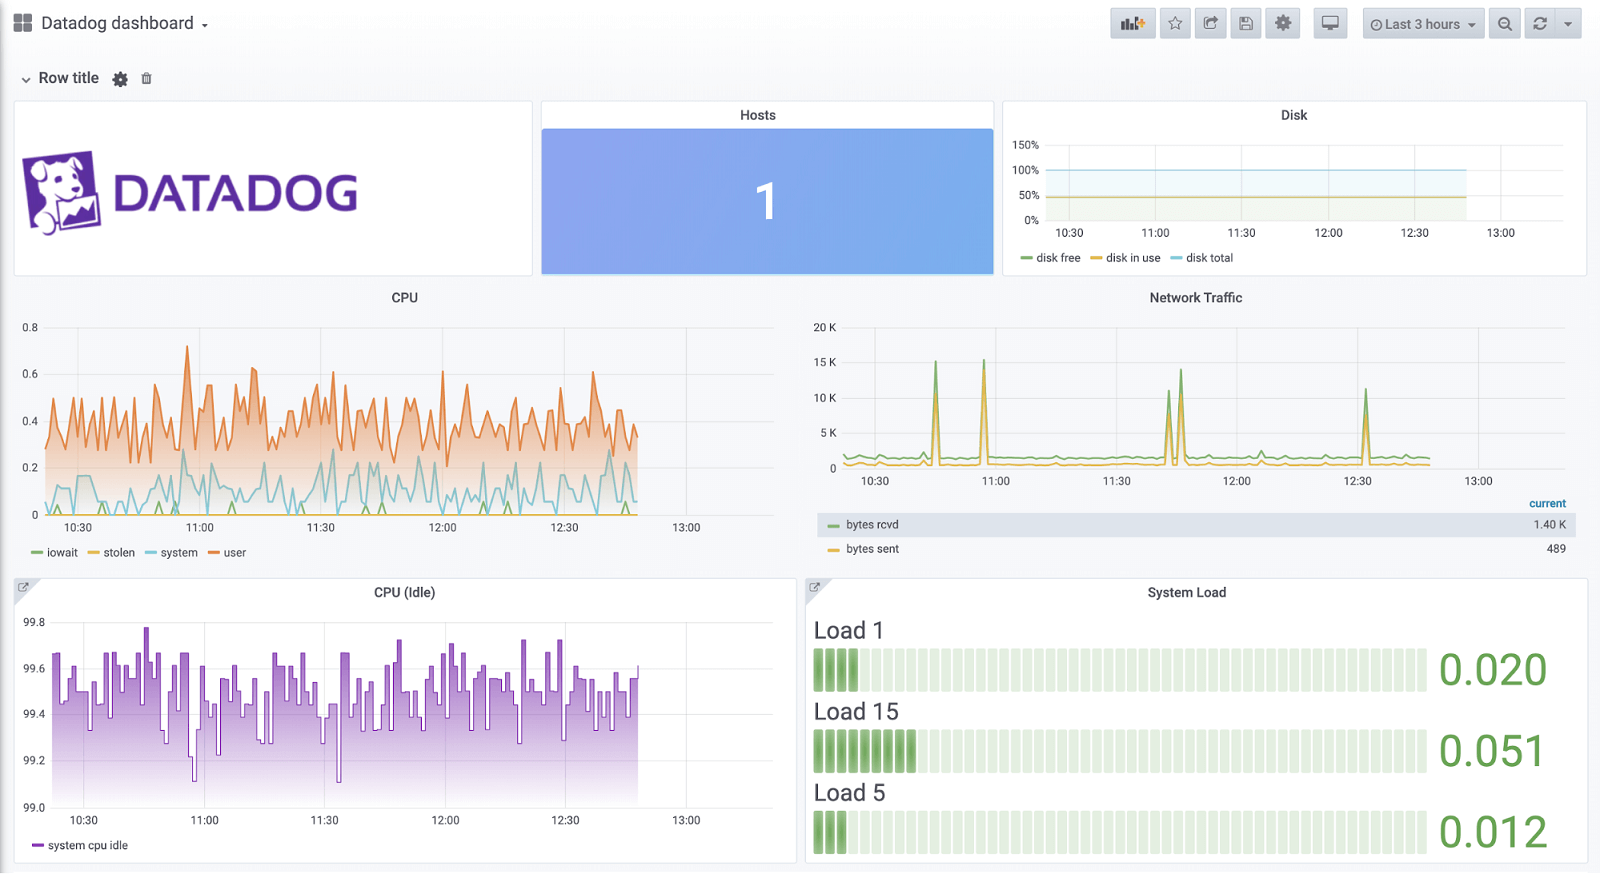
In our example dashboard, we are visualizing some infrastructure metrics with our graph panel (which has been replaced by the time series panel), stat panel, and bar gauge panel.
To start using Datadog as a data source, install the Datadog plugin. After, add your data source to Grafana by going to Configuration > Data Sources > Add data source. Find the Datadog data source and fill out the connection details (you will need your API and App key – more information can be found here):
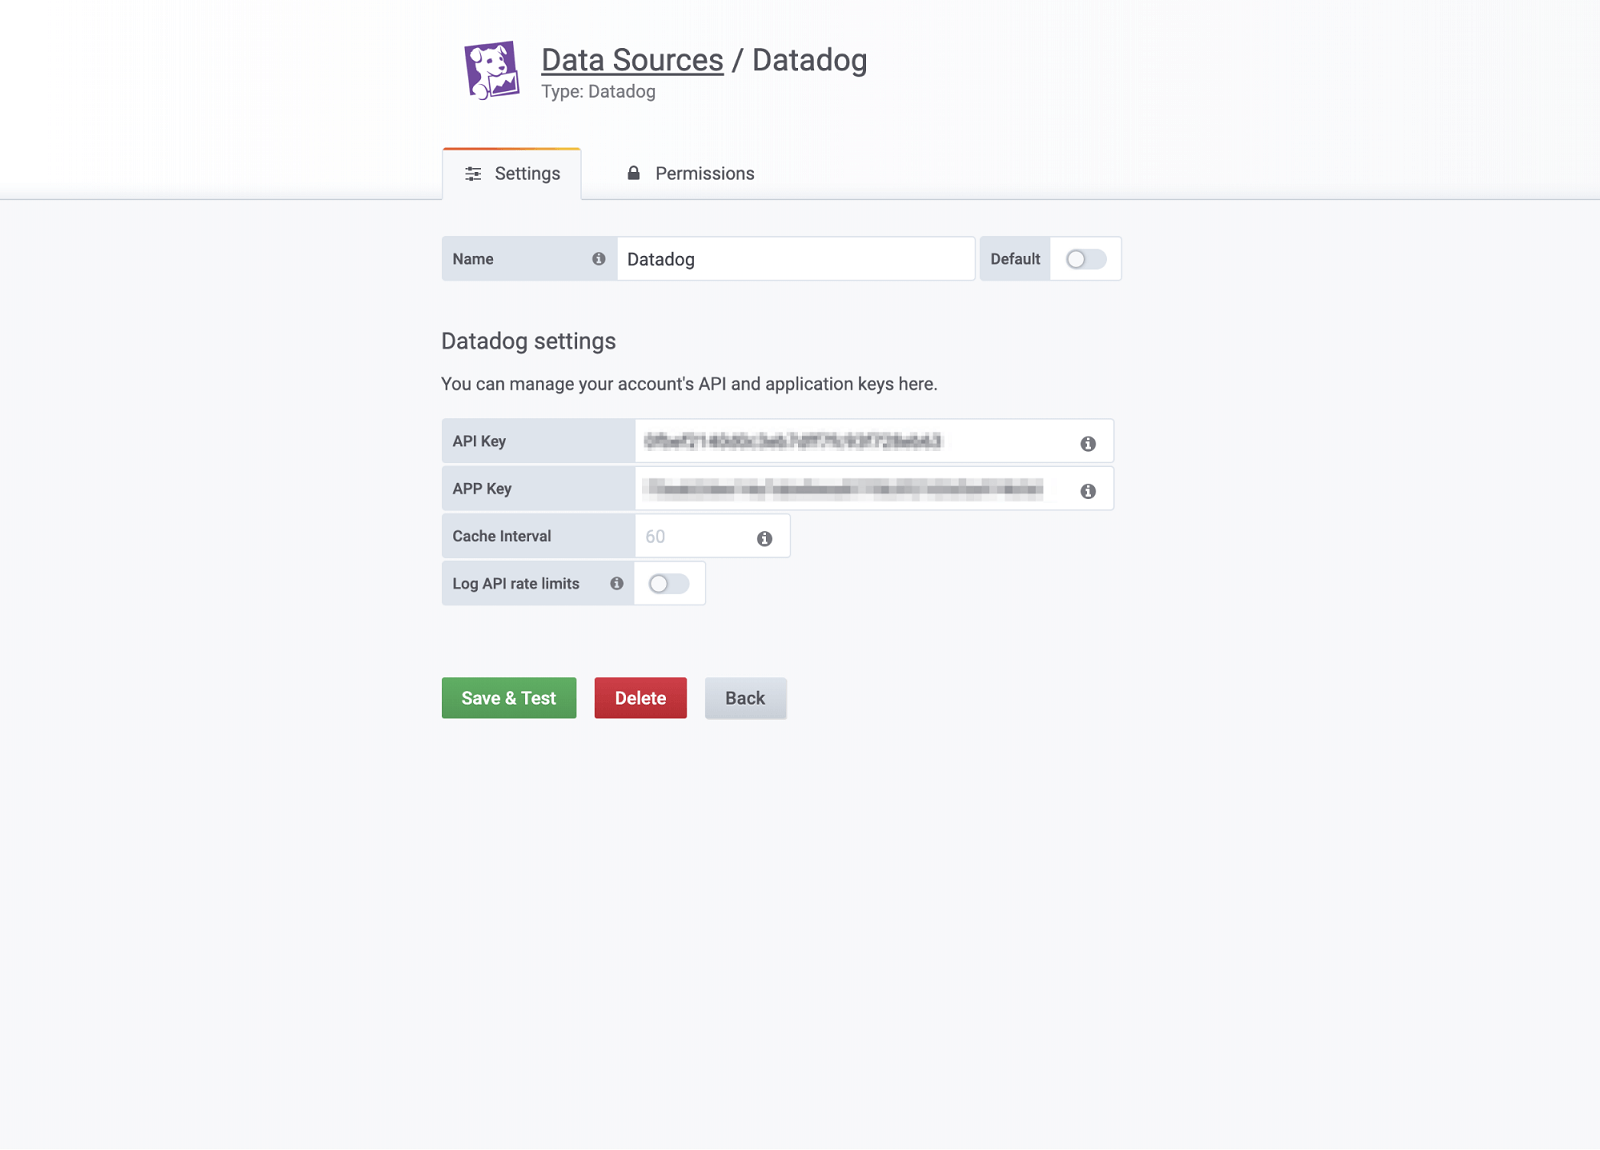
Tip: For large dashboards that will be making lots of queries, it is possible to be rate-limited by the Datadog API. The Cache Interval feature helps you bypass these limits by caching unique queries. The default is 60 seconds and can be adjusted in the configuration page.
Querying tips
Once you’ve set up your data source, let’s head over to a new dashboard and add a panel to take a look at the query editor.

If you are familiar with our other query editors, you’ll notice the Datadog editor is just as easy! Select the metric, aggregation, and select one or more tags (if you want to filter results). The data source also supports all of the advanced functions with which you are familiar. Select it from the Functions dropdown and click the left/right arrows to order the functions.
One of our go-tos is the Alias By field.
Let’s say you have this metric:
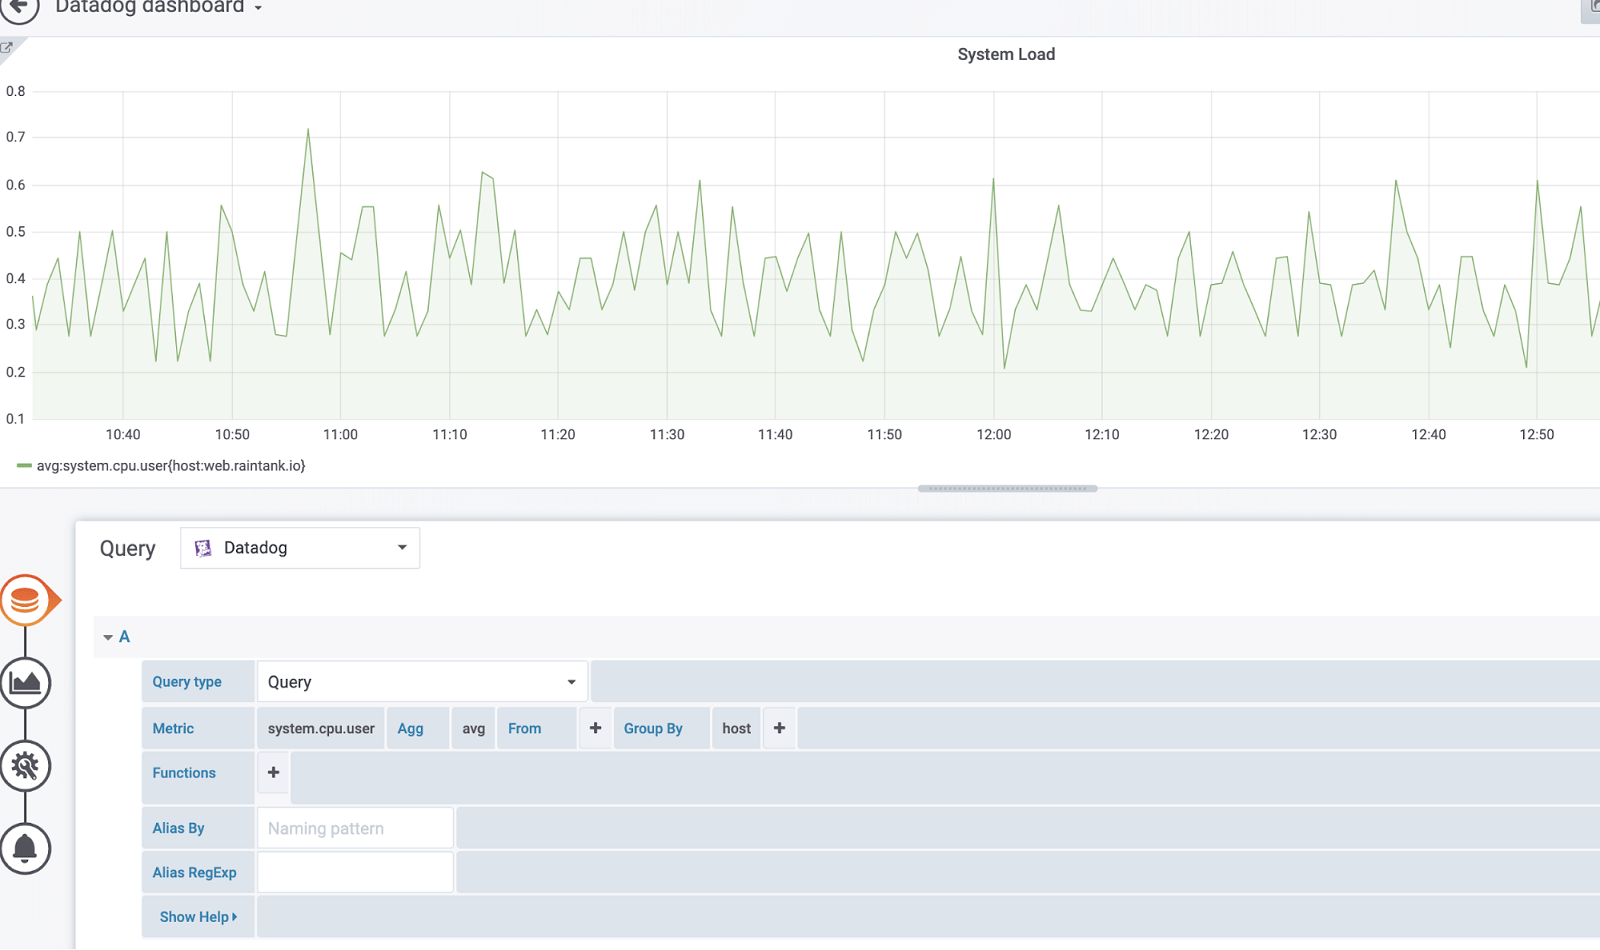
You can leverage this scoped variable $aggr($display_name) to replace the metric name and aggregation:
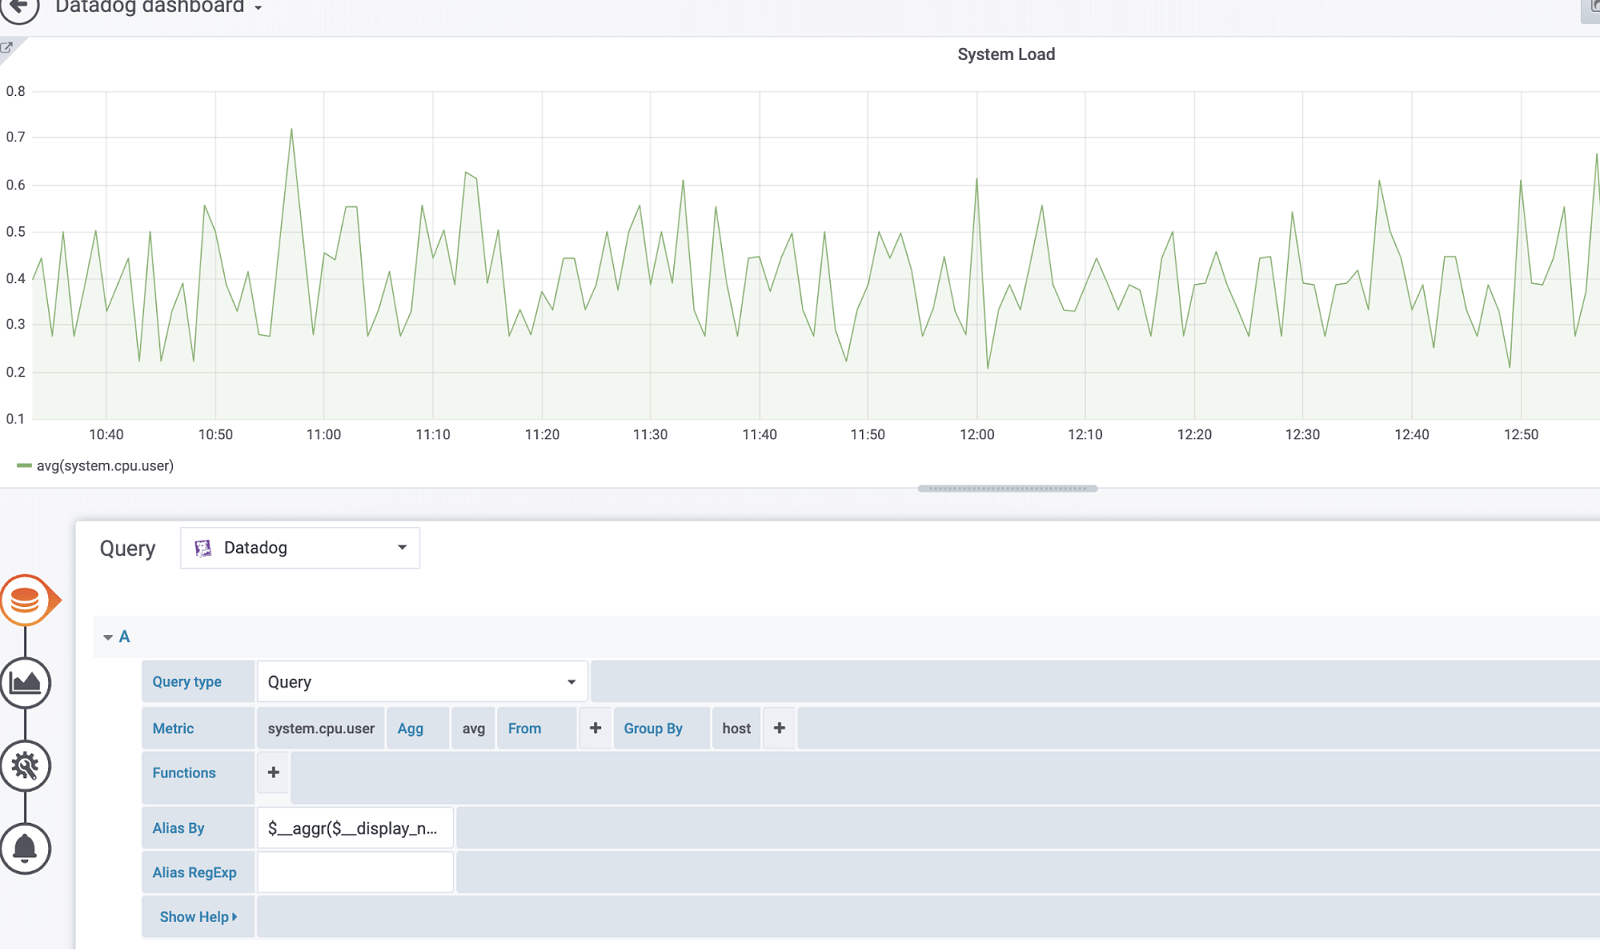
Here’s a list of available variables that can be used:
- $__metric = replaced with metric name
- $__display_name = replaced with metric name
- $__expression = replaced with full metric expression
- $__aggr = replaced with metric aggregation function (e.g. avg, max, min, sum)
- $__scope = replaced with metric scope (e.g. region, site, env, host)
We also support ever useful regular expressions!
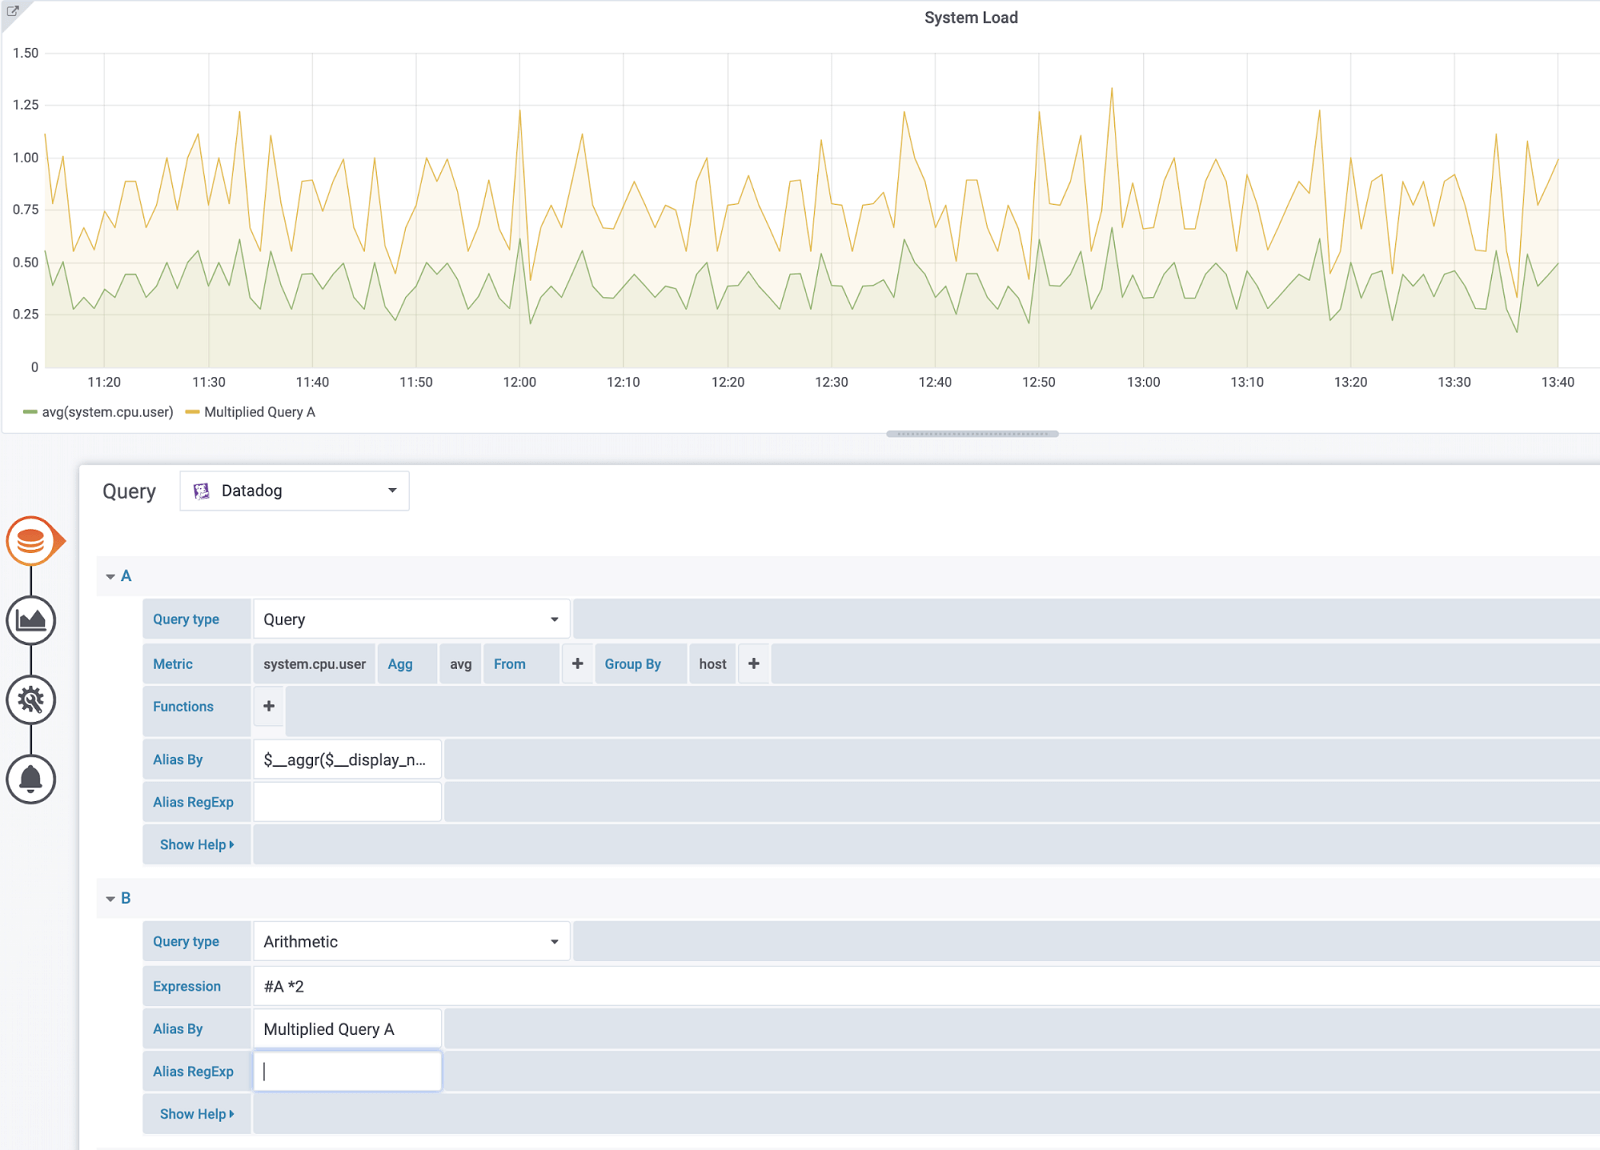
Tip for arithmetic queries: In the query type, switch it to Arithmetic. Use the pound sign (#) to reference a desired query. For example, #A * 2 will double the result of query A. Arithmetic between two metrics works the same way — you can perform calculations between two queries, such as #A / #B.
Templating!
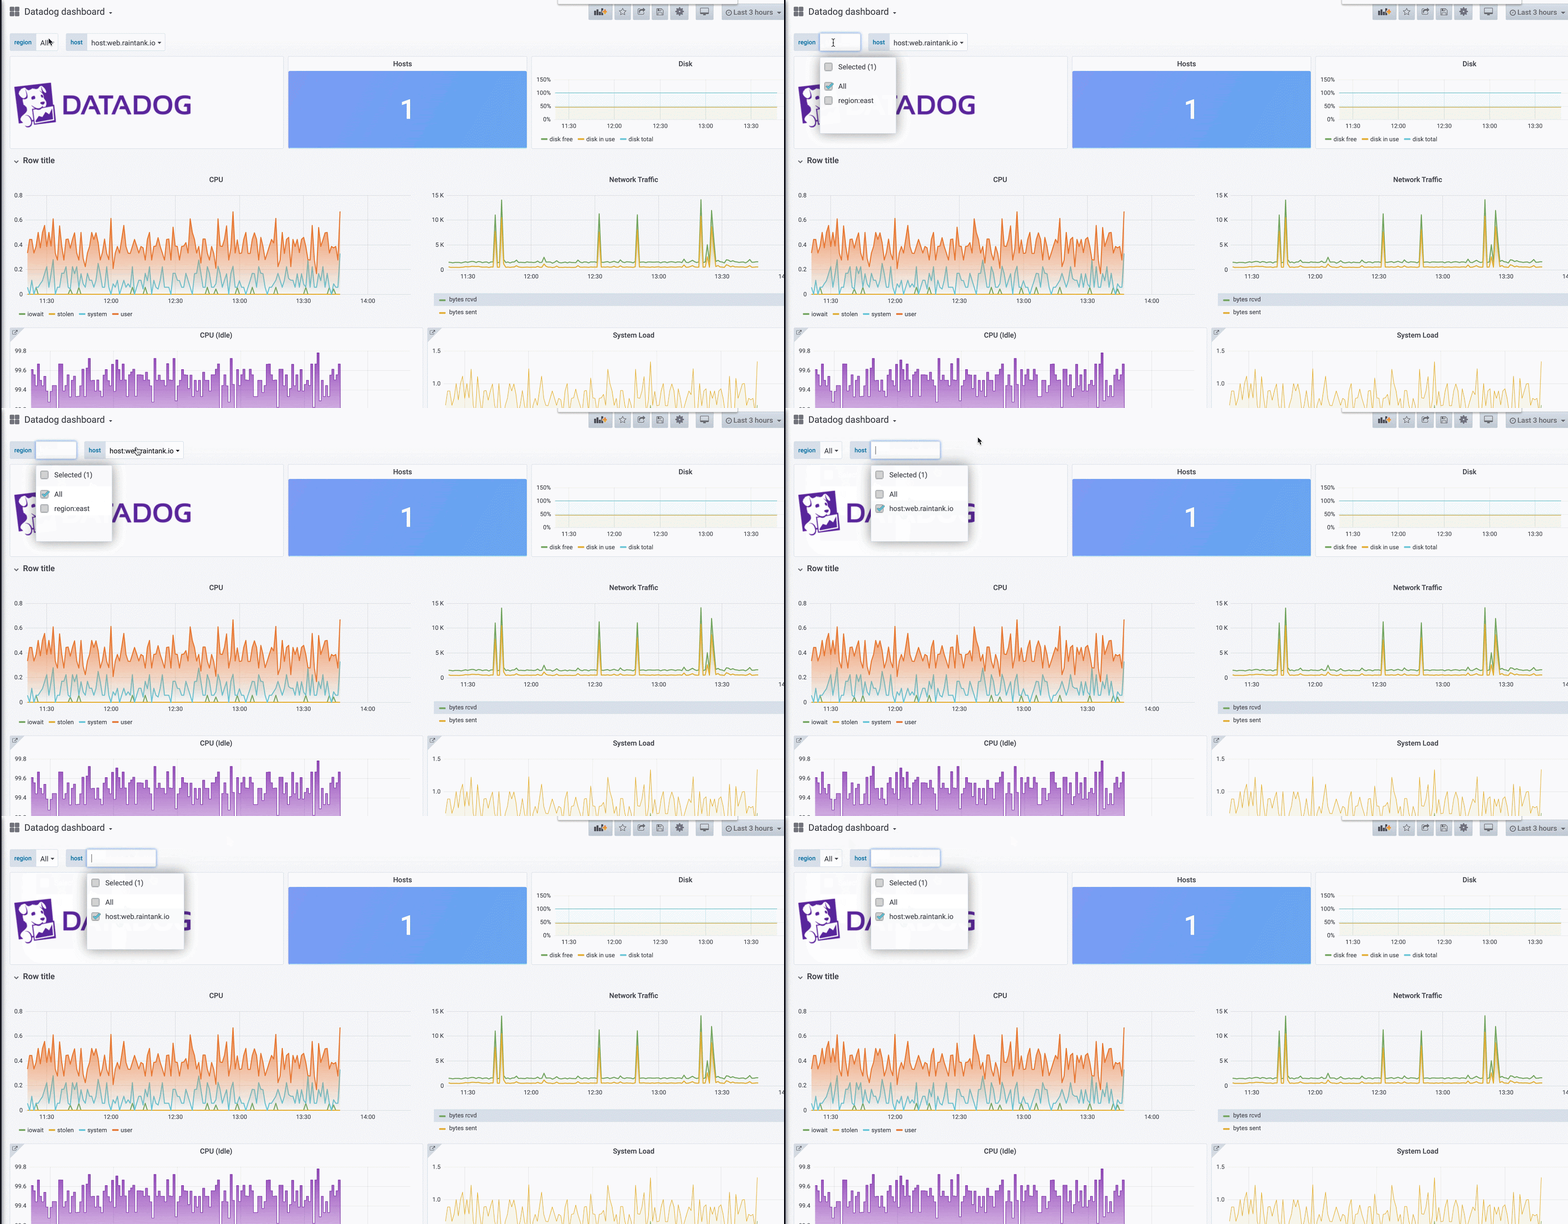
There are a few options for getting values from template variables: metrics and tags. To fetch the list of available metrics, specify the star symbol (*) in the Query field (or to return all tags, input the value tag or scope).
To return tags for a specified tag group, use one of the following default category values:
- host
- device
- env
- region
- site
- status
- version
Custom tag groups and filtered results are possible by using the Regex field.
One last thing
Our last tip is to leverage ad-hoc filters. This variable will apply to all the Datadog queries using the variable in a dashboard, so you can use it like a quick filter. An ad-hoc variable for Datadog fetches all the key-value pairs from tags (for example, region:east, region:west) and uses them as query tags.
To create this variable, select the Ad-hoc filter type and choose your Datadog data source. You can set any name for this variable.
Learn more
That’s all we have time for today. The Datadog enterprise plugin is available for customers with a Grafana Cloud account or with a Grafana Enterprise license. For more information and to get started, check out the Datadog solutions page or contact our team.
Please find us on Twitter to share your feedback and your visualizations. Happy dashboarding and until next time: Kelly and Regis out!

If you’re not already using Grafana Cloud — the easiest way to get started with observability — sign up now for a free 14-day trial of Grafana Cloud Pro, with unlimited metrics, logs, traces, and users, long-term retention, and access to one Enterprise plugin.


