
How to successfully correlate metrics, logs, and traces in Grafana
As everyone knows, the Grafana project began with a goal to make the dashboarding experience better for everyone, and to make it easy to create beautiful and useful dashboards like this one:
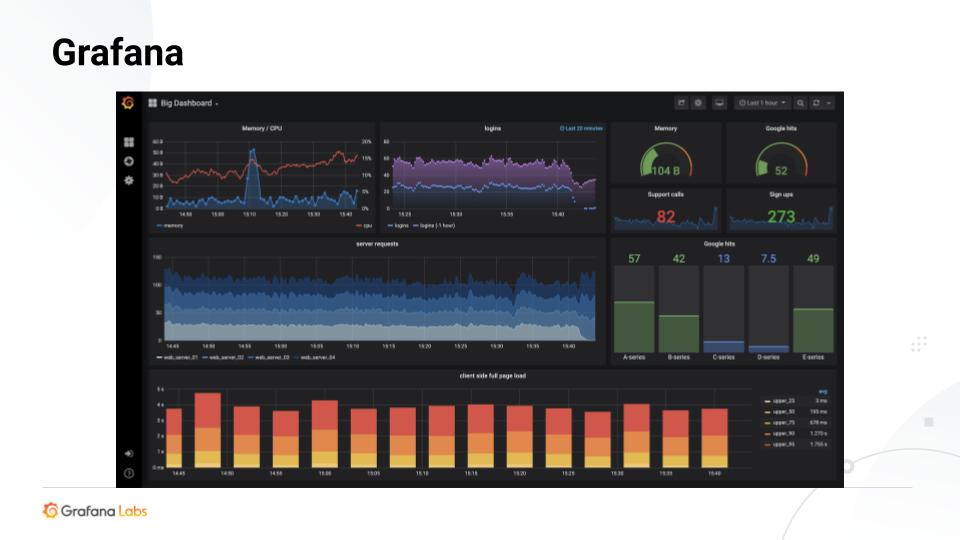
But as Andrej Ocenas, a full stack developer at Grafana Labs, said in a recent FOSDEM 2020 presentation, the company has bigger ambitions for Grafana than just being a beautiful dashboarding application.
What Grafana Labs is really aiming to do now is make Grafana into a full observability platform. That means not only showing users their metrics, logs, and traces, he said, but also providing them with the ability “to be able to correlate between them and be able to use all three of those pillars to quickly solve their issues.”
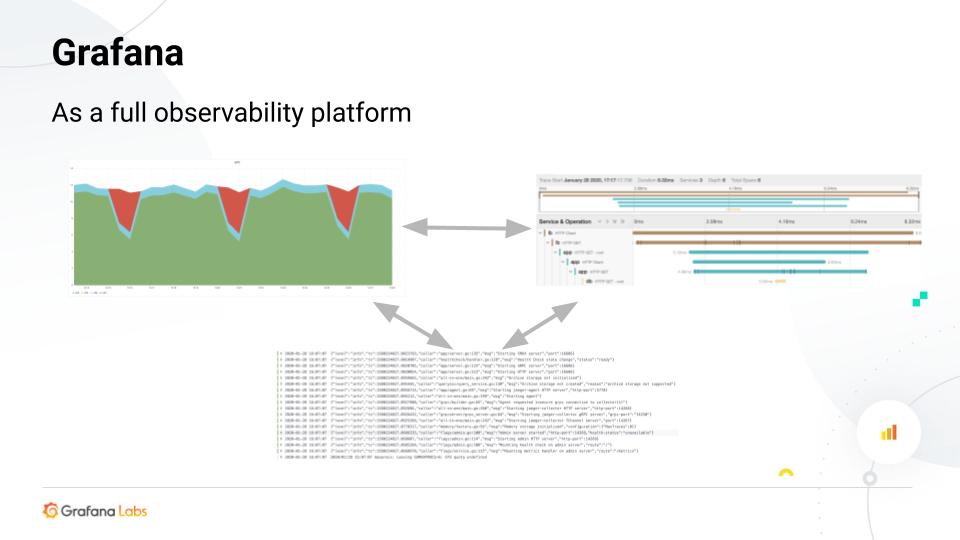
In his talk, Ocenas covered the current capabilities of Grafana to integrate metrics, logs and traces, gave demonstrations of how to set up both Grafana and application code in order to enable them, and discussed plans for how to make all of this even easier in the future.
One reason Grafana would be an ideal observability platform? It’s open source and also open as a platform, so you can use whatever data source – or combination of data sources – you want with it.
“That also means that any data source plugin can implement our APIs, and be able to participate in the observability picture,” he said. It could also provide the same features he went on to highlight in his presentation.
From metrics to logs
First up: how to correlate metrics and logs in Grafana.
“Imagine you have service, you see a spike of your error responses, and you want to quickly go to your logs to figure out what’s happening and why it’s erroring out,” Ocenas said. “Usually this can be time consuming, especially if your logs are living in some other system than your metrics.”
Grafana wants to make this easier, but a few things are required:
App instrumentation. Specifically, you need Prometheus and Loki, which are the first data source plugins that implement the correct API for this.
Matching labels for both systems. Prometheus and Loki both use labels to tag their data, which can be used for querying. By using the same labels for both, you’re able to extract the important bits from a Prometheus query and use it in a Loki query.
Grafana with configured data sources. You configure them as you would any other data source.
Instrumentation and labels: Prometheus
This is a go snippet of how you would instrument your app in Prometheus.
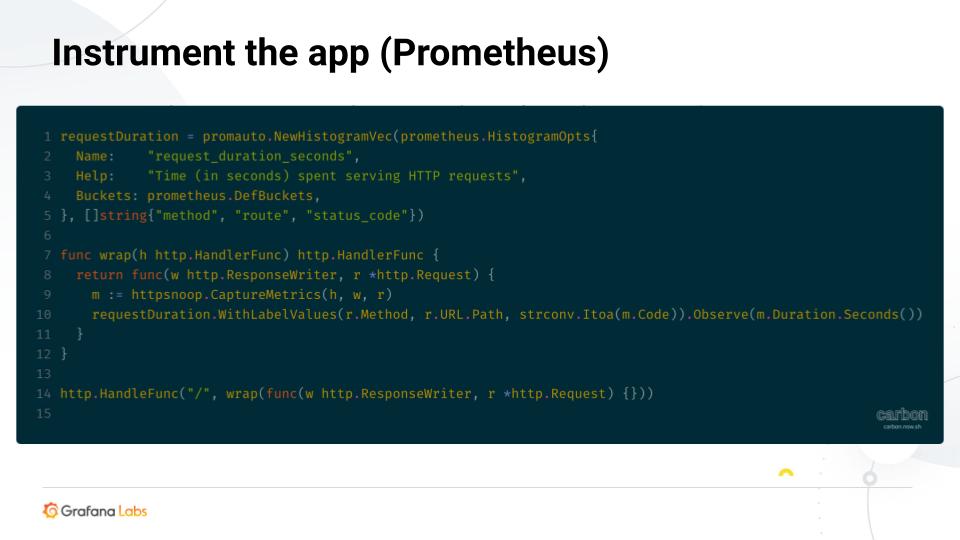
“Prometheus works in a way that you need to expose your metrics in one endpoint, then Prometheus scrapes that endpoint and gets the metrics from there in periodic intervals,” Ocenas explained. “There are lots of client libraries or exporters that will do this for you.”
In this particular case, it’s exposing a histogram of your request duration.
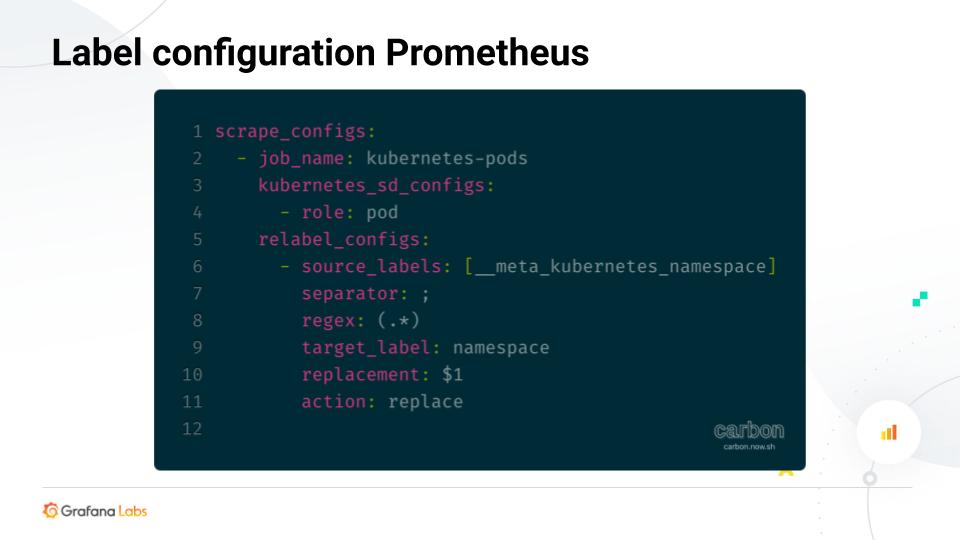
You have to configure labels on the server side of Prometheus, where you define what targets should Prometheus scrape.
“In Grafana, we use Kubernetes a lot, and Prometheus has a very nice integration with Kubernetes where it can autodiscover all your services and labels from the Kubernetes API,” he said. “So it’s easy to create labels.”
This is configured by the kubernetes_sd_configs key.
One thing to note: It will give you labels which are prefixed with a double underscore. Prometheus, by default, drops those. So you still have to do a relabeling configuration when you use those autodiscovered labels to create your actual labels in Prometheus.
“Usually you wouldn’t want to do this manually,” he noted. To make the setup easier, you’d ideally use something like predefined Helm charts or Jsonnet libraries if you use Tanka.
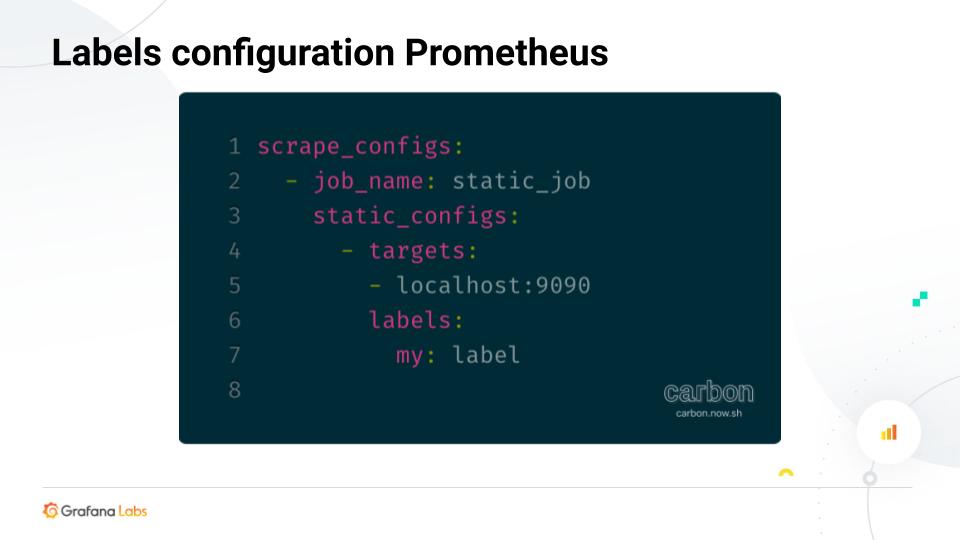
If you don’t want to use Kubernetes or the autodiscovery feature, you’ll need to configure labels statically, as demonstrated here:
Instrumentation and labels: Loki
“For Loki, you do not need any special logging client library,” Ocenas said. “You can probably use whatever you are already using.”
Here is a gokit logging snippet, which is used in multiple Grafana applications:
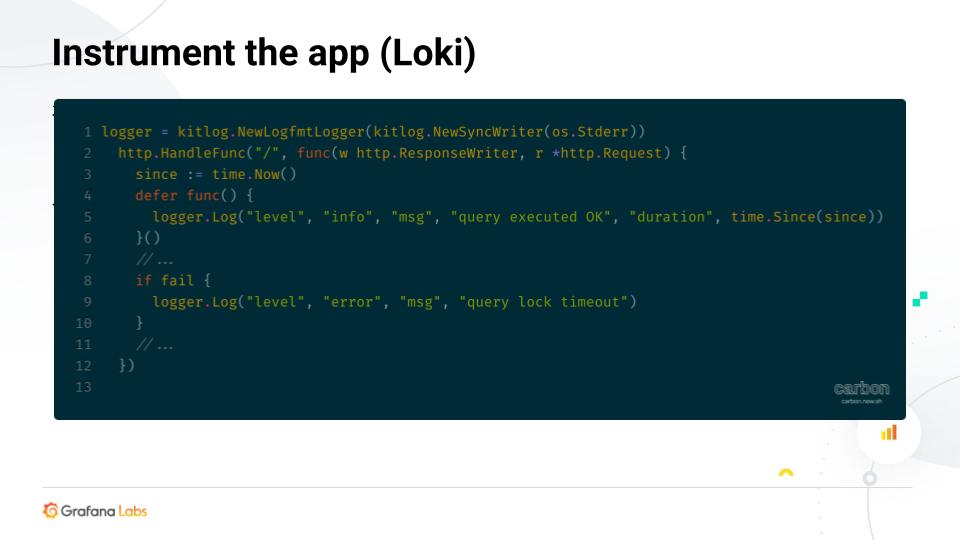
Keep in mind this doesn’t get your logs to Loki right away.
For that, you would use something like a fluentd, fluentbit, or a Docker logging driver. You could also use promtail agent, which is what Ocenas used in his example. “That way, it’ll be something that runs next to your application and it works in a way that it scrapes your log files and then sends the logs to Loki,” he explained.

“One nice thing about the promtail agent,” he said, “is that it uses the same autodiscovery feature and mechanism as Prometheus.”
It also will give you the same labels, though – once again – they will be prefixed by a double underscore, so you will have to relabel them to make sure they match the Prometheus ones.
One important thing to note is that with the autodiscovery feature, you need to create a special label for Promtail to know what to scrape: __path__ (See the bottom line in the image above.)
As with the Prometheus example, Ocenas recommended using a predefined configuration template to make sure the final labels are the same in Prometheus and Loki.
Queries
Having the same labels allows you to run similar queries and get data that is correlated across the apps.
At the top of the example pictured below is a Prometheus query. You can take the labels from there and create a Loki query that will give you data that correlates to the metric.

This is easy to integrate since Prometheus and Loki have a similar query language and labeling system. But any data source can implement an API that will allow it to translate the query from other data sources into its own query language, Ocenas said.
He then ran a live demo, which begins at 8:36 in his presentation.
From logs to traces
When it comes to adding traces to the story, “This integration is a little bit simpler and more generic,” Ocenas said.
The requirements:
App instrumentation for traces. It works with any tracing backend but Ocenas used Jaeger in this case.
Logging traceIds. You need to make sure your app is logging the traceId in its logs.
Configured Loki datasource. It needs to link to the trace UI in Jaeger.
Instrumentation
Below is an example of a snippet that creates a Jaeger tracer, then uses an OpenTracing API to set the tracer as a global tracer for the application.

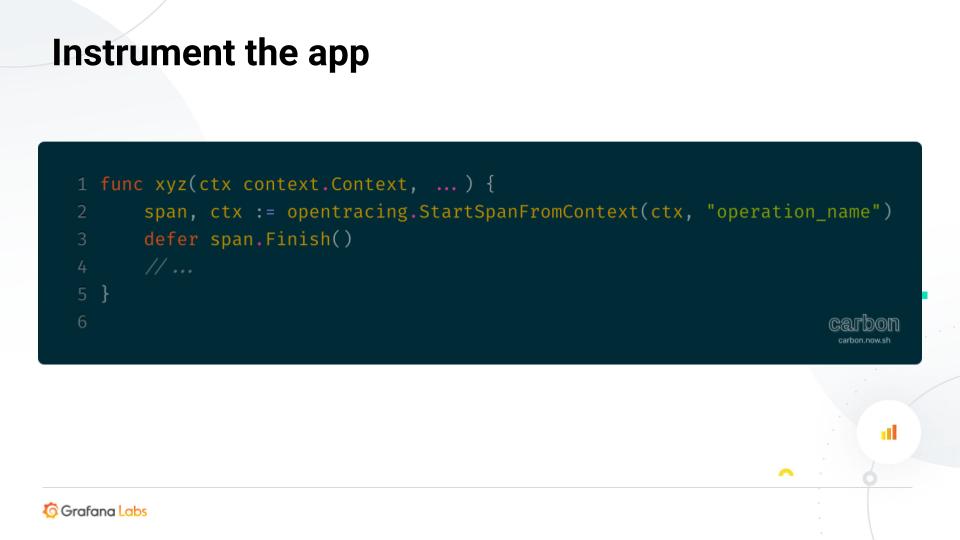
Then, you’d create a span for an operation somewhere else, as seen in the example below. You could do it manually, Ocenas said, “but ideally you would want your web framework to handle that for you – especially creating the trace on the request and then propagating the trace across service boundaries.”
Again, this example uses an OpenTracing API that wraps the Jaeger tracer.
You also need the traceId in your logs.
“This is a little bit more complex than you would probably expect,” he noted, “mainly because the OpenTracing API doesn’t actually know about a traceId for them. It’s kind of like internal implementation of the tracer.” (Ocenas said he thought that would change soon.)
“But here we have to get the OpenTracing context and then cast it into a Jaeger-specific context, then get the traceId from there.”

Ocenas then ran another live demo, beginning at 13:45 in his presentation.
What’s still missing – and being worked on
What the demo showed is that it would be much better to go from a latency graph directly to a slow trace. This is especially true as you don’t have an easy way to filter for the traces that took the most time to figure out what’s wrong.
“So for this, we need support from the backends, from the data source themselves,” Ocenas said. “The Prometheus team is actually working on this.” Their plan is to do with exemplars or an example traceId associated with a given metric and a histogram bucket.
“You’d have your 99th percentile bucket, and you would just already have some traceId there that we could use in Grafana and link you directly from the graph to the correct trace – make it easier to get there,” he explained.
This will be implemented in Grafana soon.

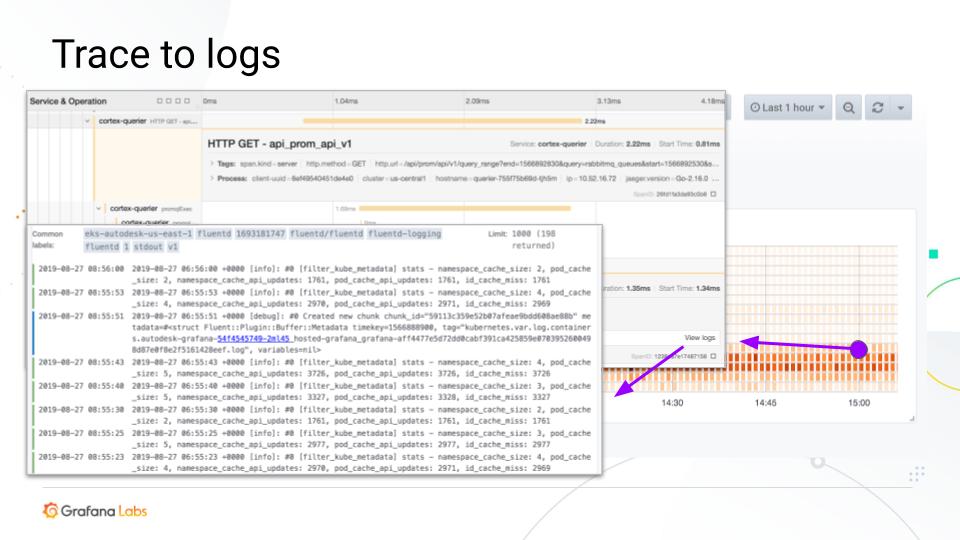
Another thing he said would be great would be to go from traces to somewhere else – like the logs that were generated by a particular trace.
To make this possible, a team is working on integrating a trace viewer directly into Grafana.
Grafana “Experiences”
In general, Grafana Labs wants to make this kind of connectivity between data sources as easy as possible, Ocenas said. So the company is working on introducing something called Experience (which is a working title).

So what is it?
“Usually your data sources are grouped in some logical way,” he said. “You have your metrics, tracing, and logging that the source can monitor one application. And then you may have another group of data sources that are monitoring some other application or cluster. Right now, there is no way in Grafana to express this because we just have a flood list of data sources without any connection in between.”
The idea, he said, is to have a concept in Grafana that would allow users to have a fully connected experience across multiple data sources and views, without having to manually configure each connection.
That also means users wouldn’t need additional configuration if Grafana added a new view or transition because it would already know which data sources are linked together.
“We hope this will drive better interfaces in Grafana,” he said, “and will make the correlation story in Grafana much better for the user.”


