Pro tip: How to monitor client certificate expirations with Prometheus
Certificates can be difficult to track and opaque to administrators, and if any expire without someone noticing, embarrassing outages can happen. At Grafana Labs we strive to make all things visible and observable; why should certificates be any exception?
In this post we will explore an easy way to expose and monitor certificate expirations using Grafana and Prometheus.
I recently generated some etcd client certs for use by other applications in my cluster, but I realized I had no way to observe the expiration on these certs.
Like most things in the Prometheus world, there is a ready-to-go exporter for certs. Unfortunately, in this case, the exporter only supports a subset of the certificates I wanted to expose. What about client certs sitting on disk? Or in Kubernetes secrets? These very important pieces of information are not accessible to the blackbox exporter.
cert-exporter to the rescue! I designed this exporter specifically to expose information about certificates that the blackbox exporter cannot handle. Namely:
- x509 certificates on disk in PEM format;
- certs embedded or referenced from kubeconfig files; and
- certs stored in Kubernetes secrets. This supports applications such as cert-manager.
In particular these features helped us track all of the certs used in a kops-based Kubernetes cluster. As a result, we could feel confident we could schedule certificate rotations well before any issues arose.
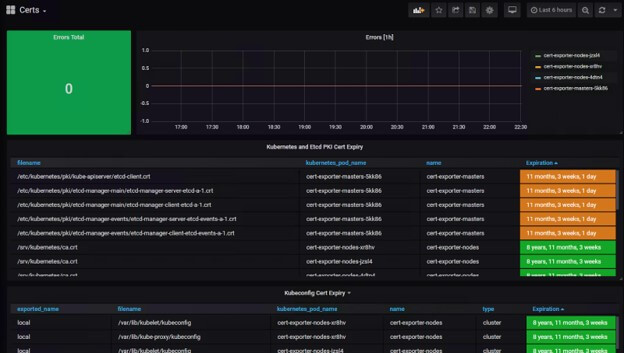
The repo also contains a fancy Grafana dashboard that clearly shows the list of certificates cert-exporter is monitoring. It is currently set up to highlight certificates nearing expiration in orange and red, but of course that is all customizable. Cert-exporter also publishes an error counter that is displayed at the top of the dashboard.

For more information
Check out the readme for more details and pull cert-exporter to get started today!


