How SkySilk Cloud Services uses Grafana dashboards
Stefano Mitchell is a customer support engineer at SkySilk Cloud Services.
It’s no secret that there is a correlation between a team having quick access to metrics and swift resolutions. Accurate monitoring metrics displayed in a clear and efficient manner help your teams respond to alerts and issues as they arise in real time.

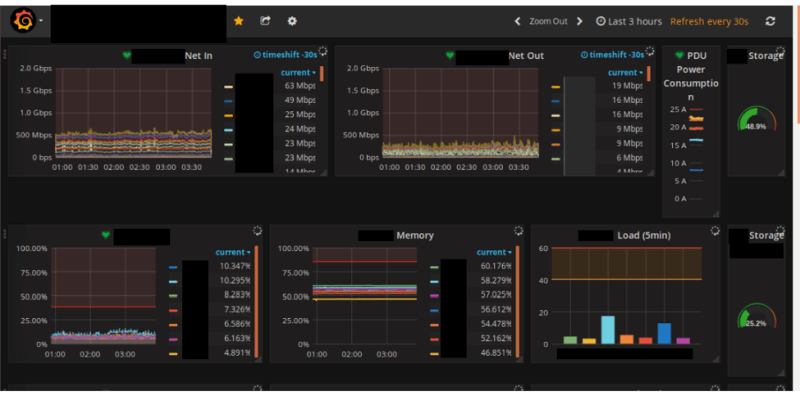
SkySilk Cloud Services, a cloud services provider, uses Grafana dashboards internally to maintain a strong overview of regional system health. This free and open source software has made analyzing and monitoring data sources efficient yet beautiful. We go as far as utilizing a TV in the office to show the local region’s dashboard.
Real-time analytics and monitoring
“Grafana has been an invaluable open source tool for us to monitor our internal infrastructure, health, and uptime of our users,” says Matt A., Project Manager at SkySilk Cloud Services. “We utilize a Grafana dashboard hosted on SkySilk servers to monitor internal SkySilk happenings. Also utilizing the Grafana API to serve specific real-time analytics and reporting information directly to our users’ dashboards. Its clean UI design and the flexible functionalities provided have proved to be indispensable to our day-to-day business.”

SkySilk not only uses Grafana dashboards to monitor services and performance in-office, but also utilizes Grafana dashboards to drill down and find the root cause of certain issues, primarily network-related. These are paired with alerts to keep the teams up-to-date and able to respond quickly. We integrate Grafana with Icinga Web 2 to display performance metrics alongside host status and system service metrics. This setup allows for all of the relevant information required to troubleshoot most requests to be contained on a single page. Less time is spent hunting for information, while more time is spent resolving what needs to be fixed.
Simplicity and community
Here at SkySilk Cloud Services, we are strong supporters of open source. This includes encouraging our users to share ideas, projects, and apps they are building. And it’s why we want to share how we use open source technology internally.
We hope to bring simplicity to a hosting platform and make it easy for users of all skill levels to deploy and manage machines.

Grafana can be used to build sleek and elegant dashboards for an unlimited number of use cases for its open source community. Because of this, SkySilk offers a one-click template for users to get themselves deployed quickly with a machine running Grafana. Spending less time setting up analytics and monitoring means spending more time developing your next great project with Grafana and its vast plugins catalog.
SkySilk is always looking forward to seeing its community members’ projects and invites you to share them on Discord.
SkySilk Cloud Services is a boutique-style cloud service provider offering simple, scalable, and affordable cloud computing solutions. Our community is full of developers, businesses, gamers, educators, students, as well as Linux enthusiasts. With that said, SkySilk offers tools that range across the entire stack.


