How to configure Grafana as code
Grafana dashboards can do a lot, but do you know how much more you can get out of them by configuring them as code?
That was the topic of a recent FOSDEM 2020 talk by Grafana Labs software developer Malcolm Holmes and Julien Pivotto, an open source consultant at Inuits. In their presentation, the pair discussed Grafonnet (a Jsonnet library to generate Grafana dashboards), provided tips and tricks about how to use it efficiently, and explained how to fully manage your Grafana instances from code.
So. Many. Dashboards.
Pivotto kicked off the talk by acknowledging Grafana’s rich UI, which makes creating nice-looking dashboards easy. Because of that, you end up wanting to create a lot of them — and the more dashboards you have, the quicker you can understand what’s going on in your infrastructure.
It all seems great, he said, until time goes by and you’re trying to maintain a set of dashboards for people with conflicting preferences and goals. Or you’re dealing with confusion because one graph shows errors in one color and a new one uses a different color. Or there’s a new feature in Grafana and you need to change 50 dashboards to use it. As a result, making sure your dashboards work and look good is no longer a simple process.
“That’s why you want to use your dashboard as code,” he said, stressing how important it is for everyone — from developers to operations people — to be able to look at a dashboard and see the same things, read the same things, and understand the dashboard exactly the way you understand it. “That’s very difficult to do.”
Grafana dashboards can be created in many ways: via the Grafana UI, via Grafana’s REST API, the Terraform provider, or even pushing them directly to the Grafana database.
“But more than that, nowadays Grafana supports file provisioning out of the box,” Pivotto explained, “which means that you can say to Grafana, ‘Hey, please go into a specific directory and look at all the JSON files that are there and load them into Grafana as dashboards.’ And when you update the files there, Grafana will automatically pick them up and update your dashboards directly, which is really nice when you want to code your dashboards and keep them aligned with what you have in your files.”
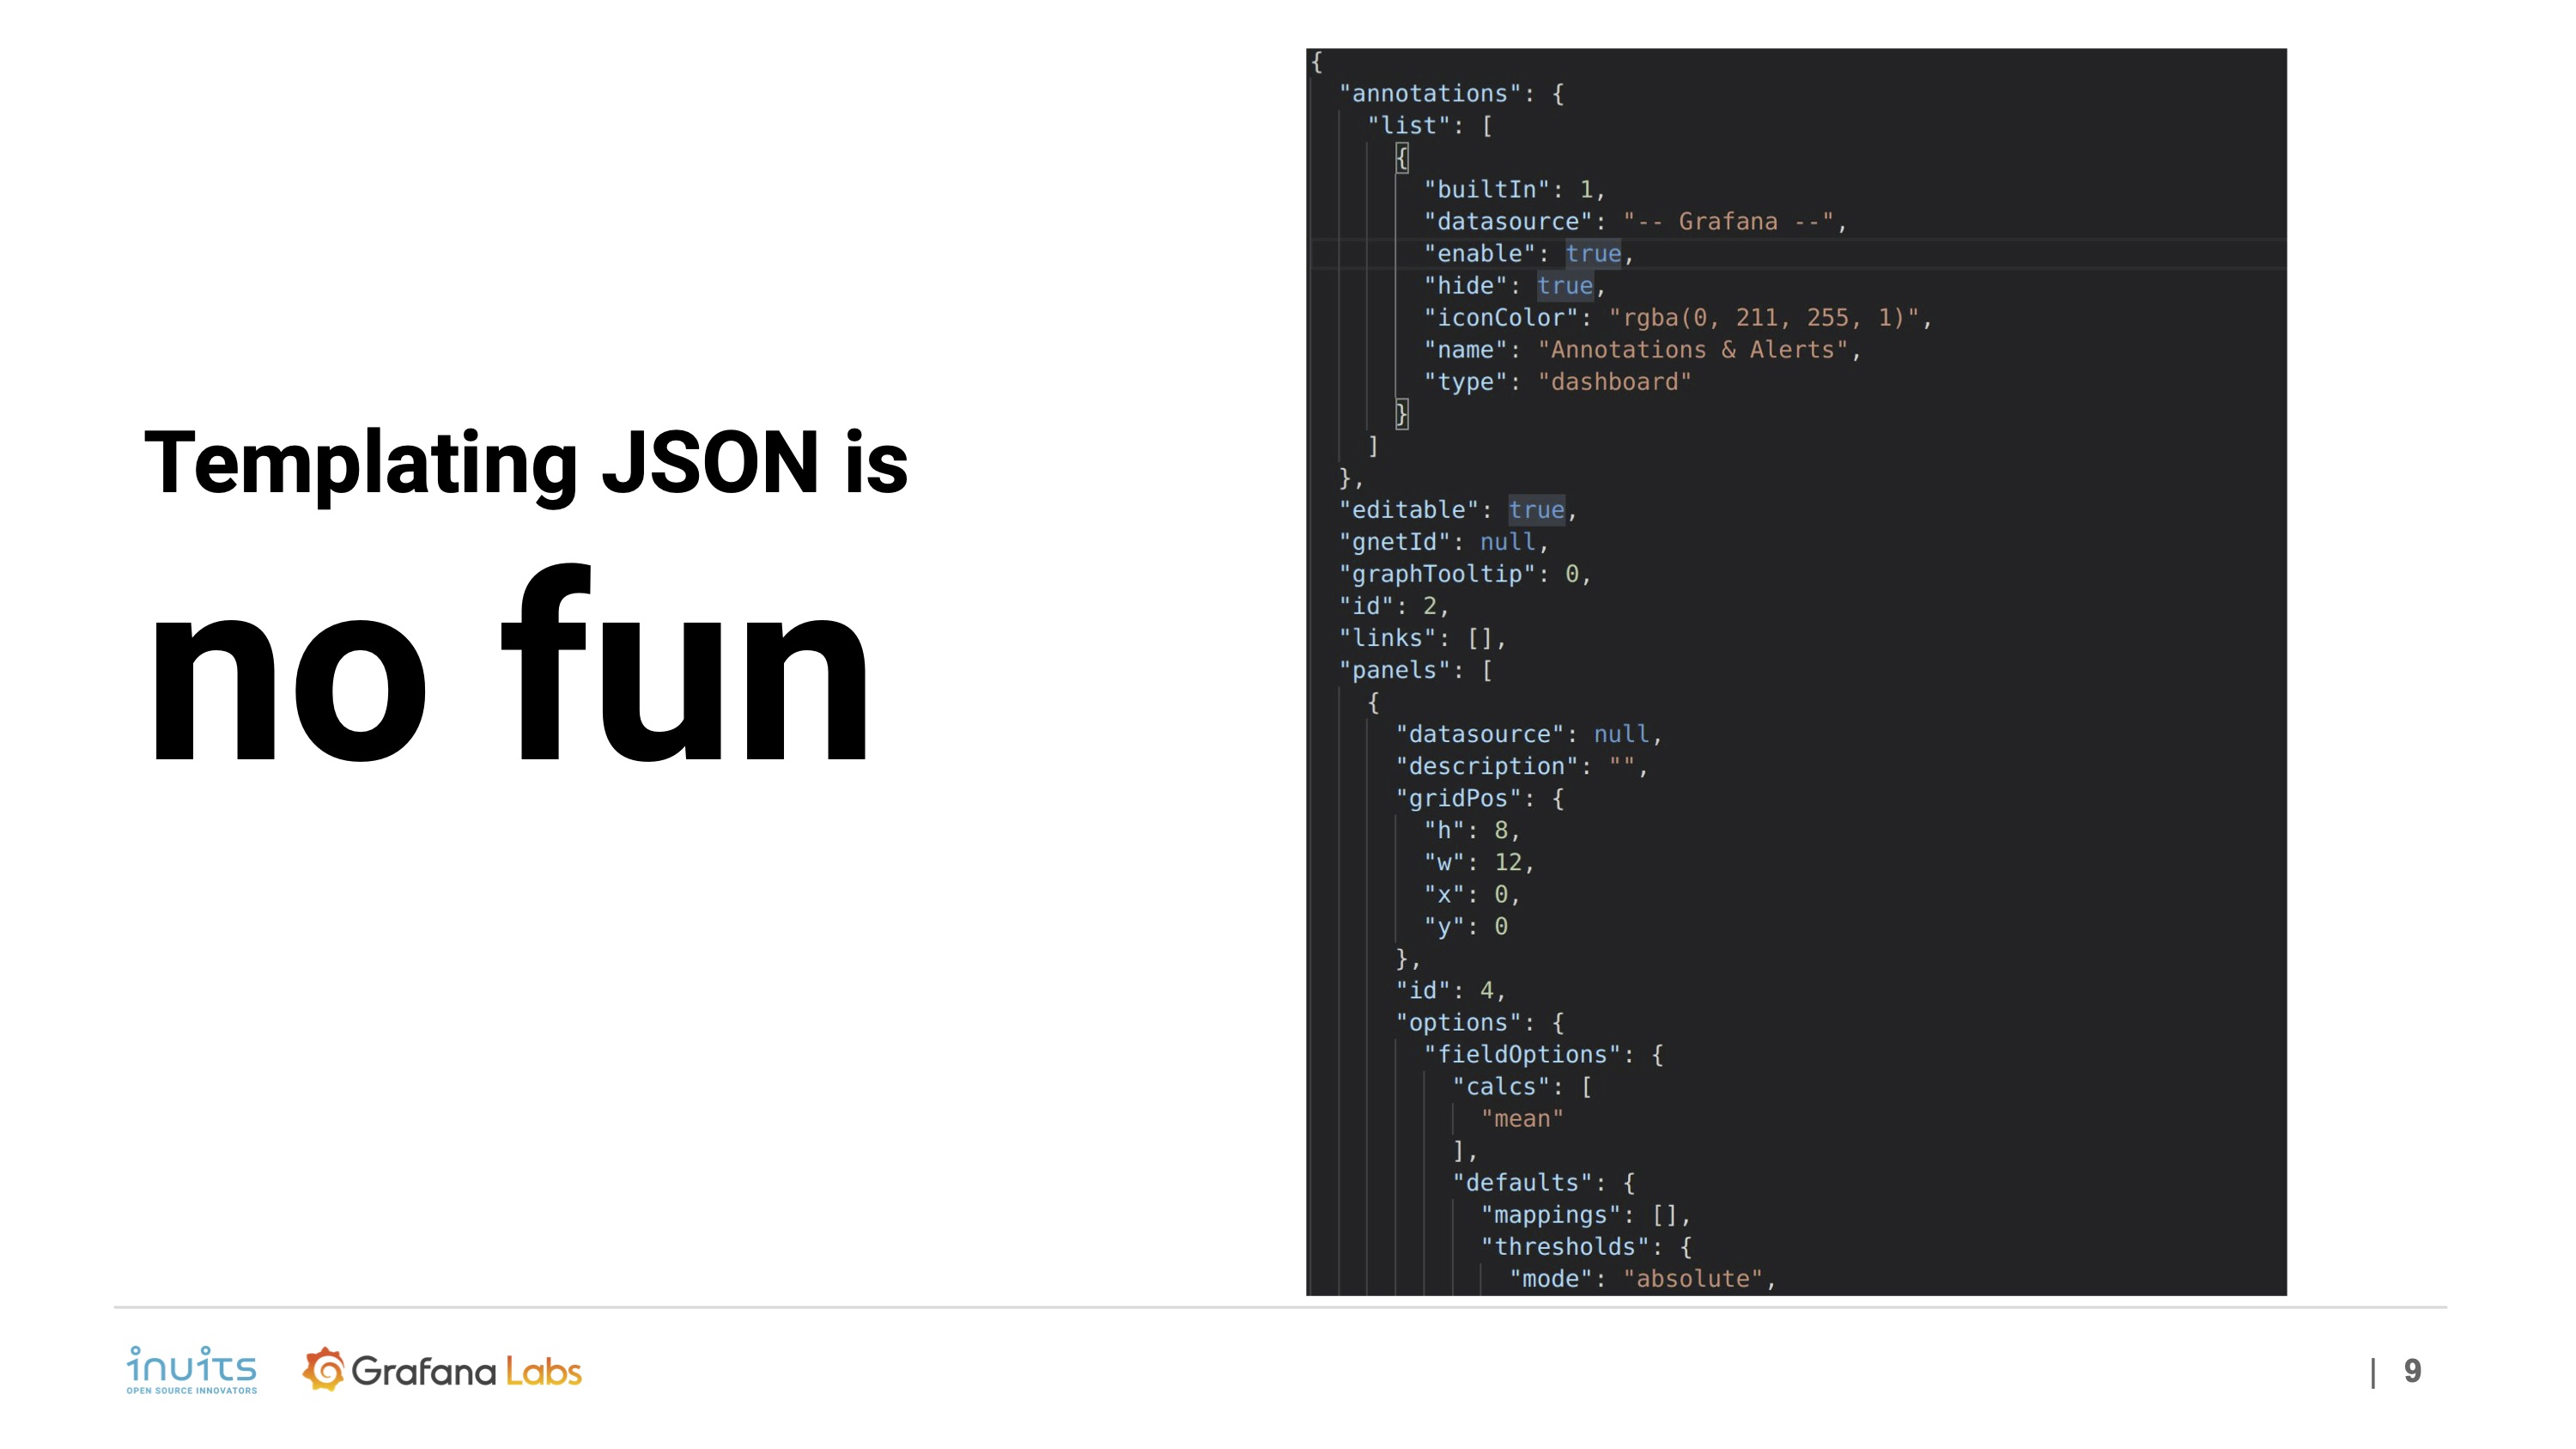
Since everything in Grafana dashboard panels is JSON, that’s quite easy. But JSON itself is “no fun,” said Pivotto, because it’s very hard to template with traditional templating systems.

Enter Jsonnet
Holmes began his part of the presentation by posing the question, “What can we do about this?”
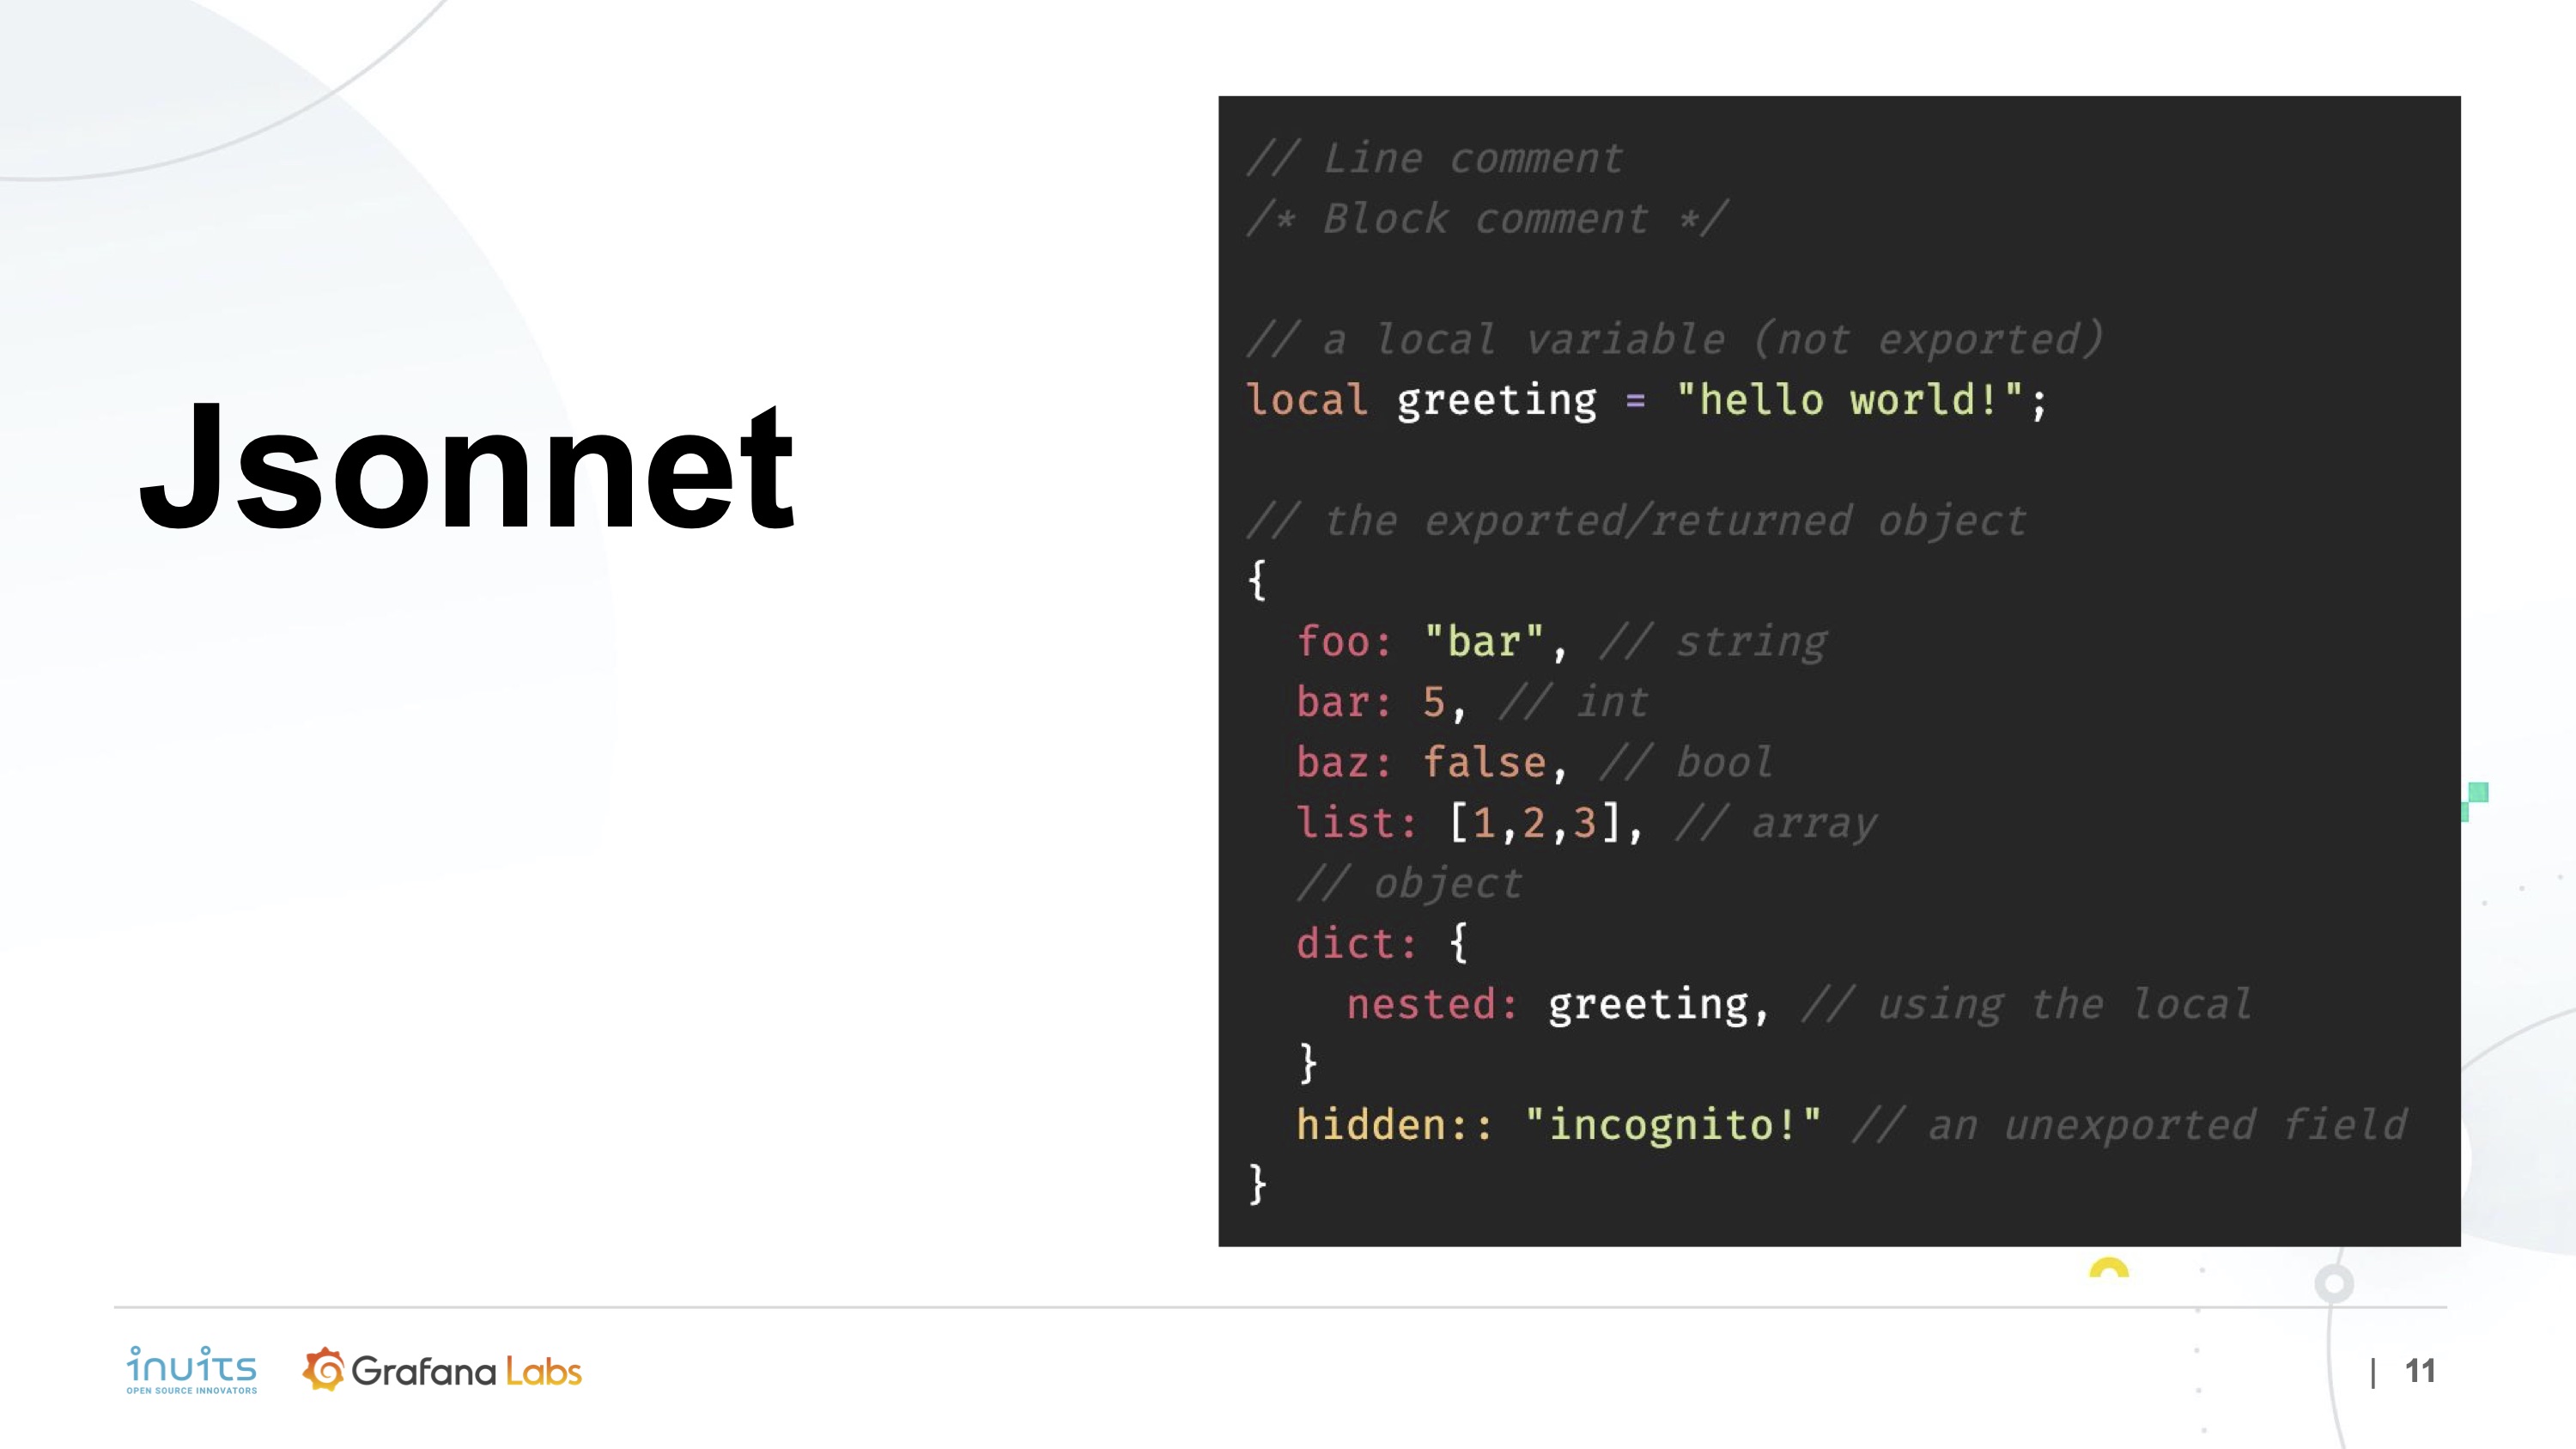
He then proposed a better way of working with JSON: with a language called Jsonnet, a superset of JSON (which is also used to deploy resources to Kubernetes). The end result of executing a Jsonnet script is JSON.
“Jsonnet has many, many language features that make it a pleasure to use, to work with, to generate JSON, and to collaborate with others in generating JSON,” he said.

Using the example above, he pointed out:
- You define a local variable and then that same local variable is referenced later.
- You get “nice little syntactic sugar” not having to use the quotes.
- The colon colon syntax means that
hiddenis available elsewhere in your program, but doesn’t end up in the final JSON output.
Aspects of the language
Holmes highlighted three aspects of Jsonnet that make it special.
Functions

In this truncated and simplified example, he said, you’re defining a new function called dashboard() with a title and a uid. “So you can see, if you imagine that this dashboard JSON was a lot longer, we can potentially encapsulate all of that in one very, very simple command.”
The problem is, in the above example, the schemaVersion is hardwired. So if you want to create a dashboard using schemaVersion:22 instead of schemaVersion:20, the dashboard function hasn’t exposed that.
Patches
To fix this problem, Jsonnet has the concept of patches. You call your Jsonnet function and append to it the snippet of JSON, and it simply adds — overwrites — schemaVersion: like so:

That bit of code is “extremely powerful,” Holmes said. “It’s allowing you to have a function that says, ‘This is what we think you’re going to need. Oh, but if there’s stuff that we haven’t thought of, hey, it’s all right. You can still extend it.’ "
Imports
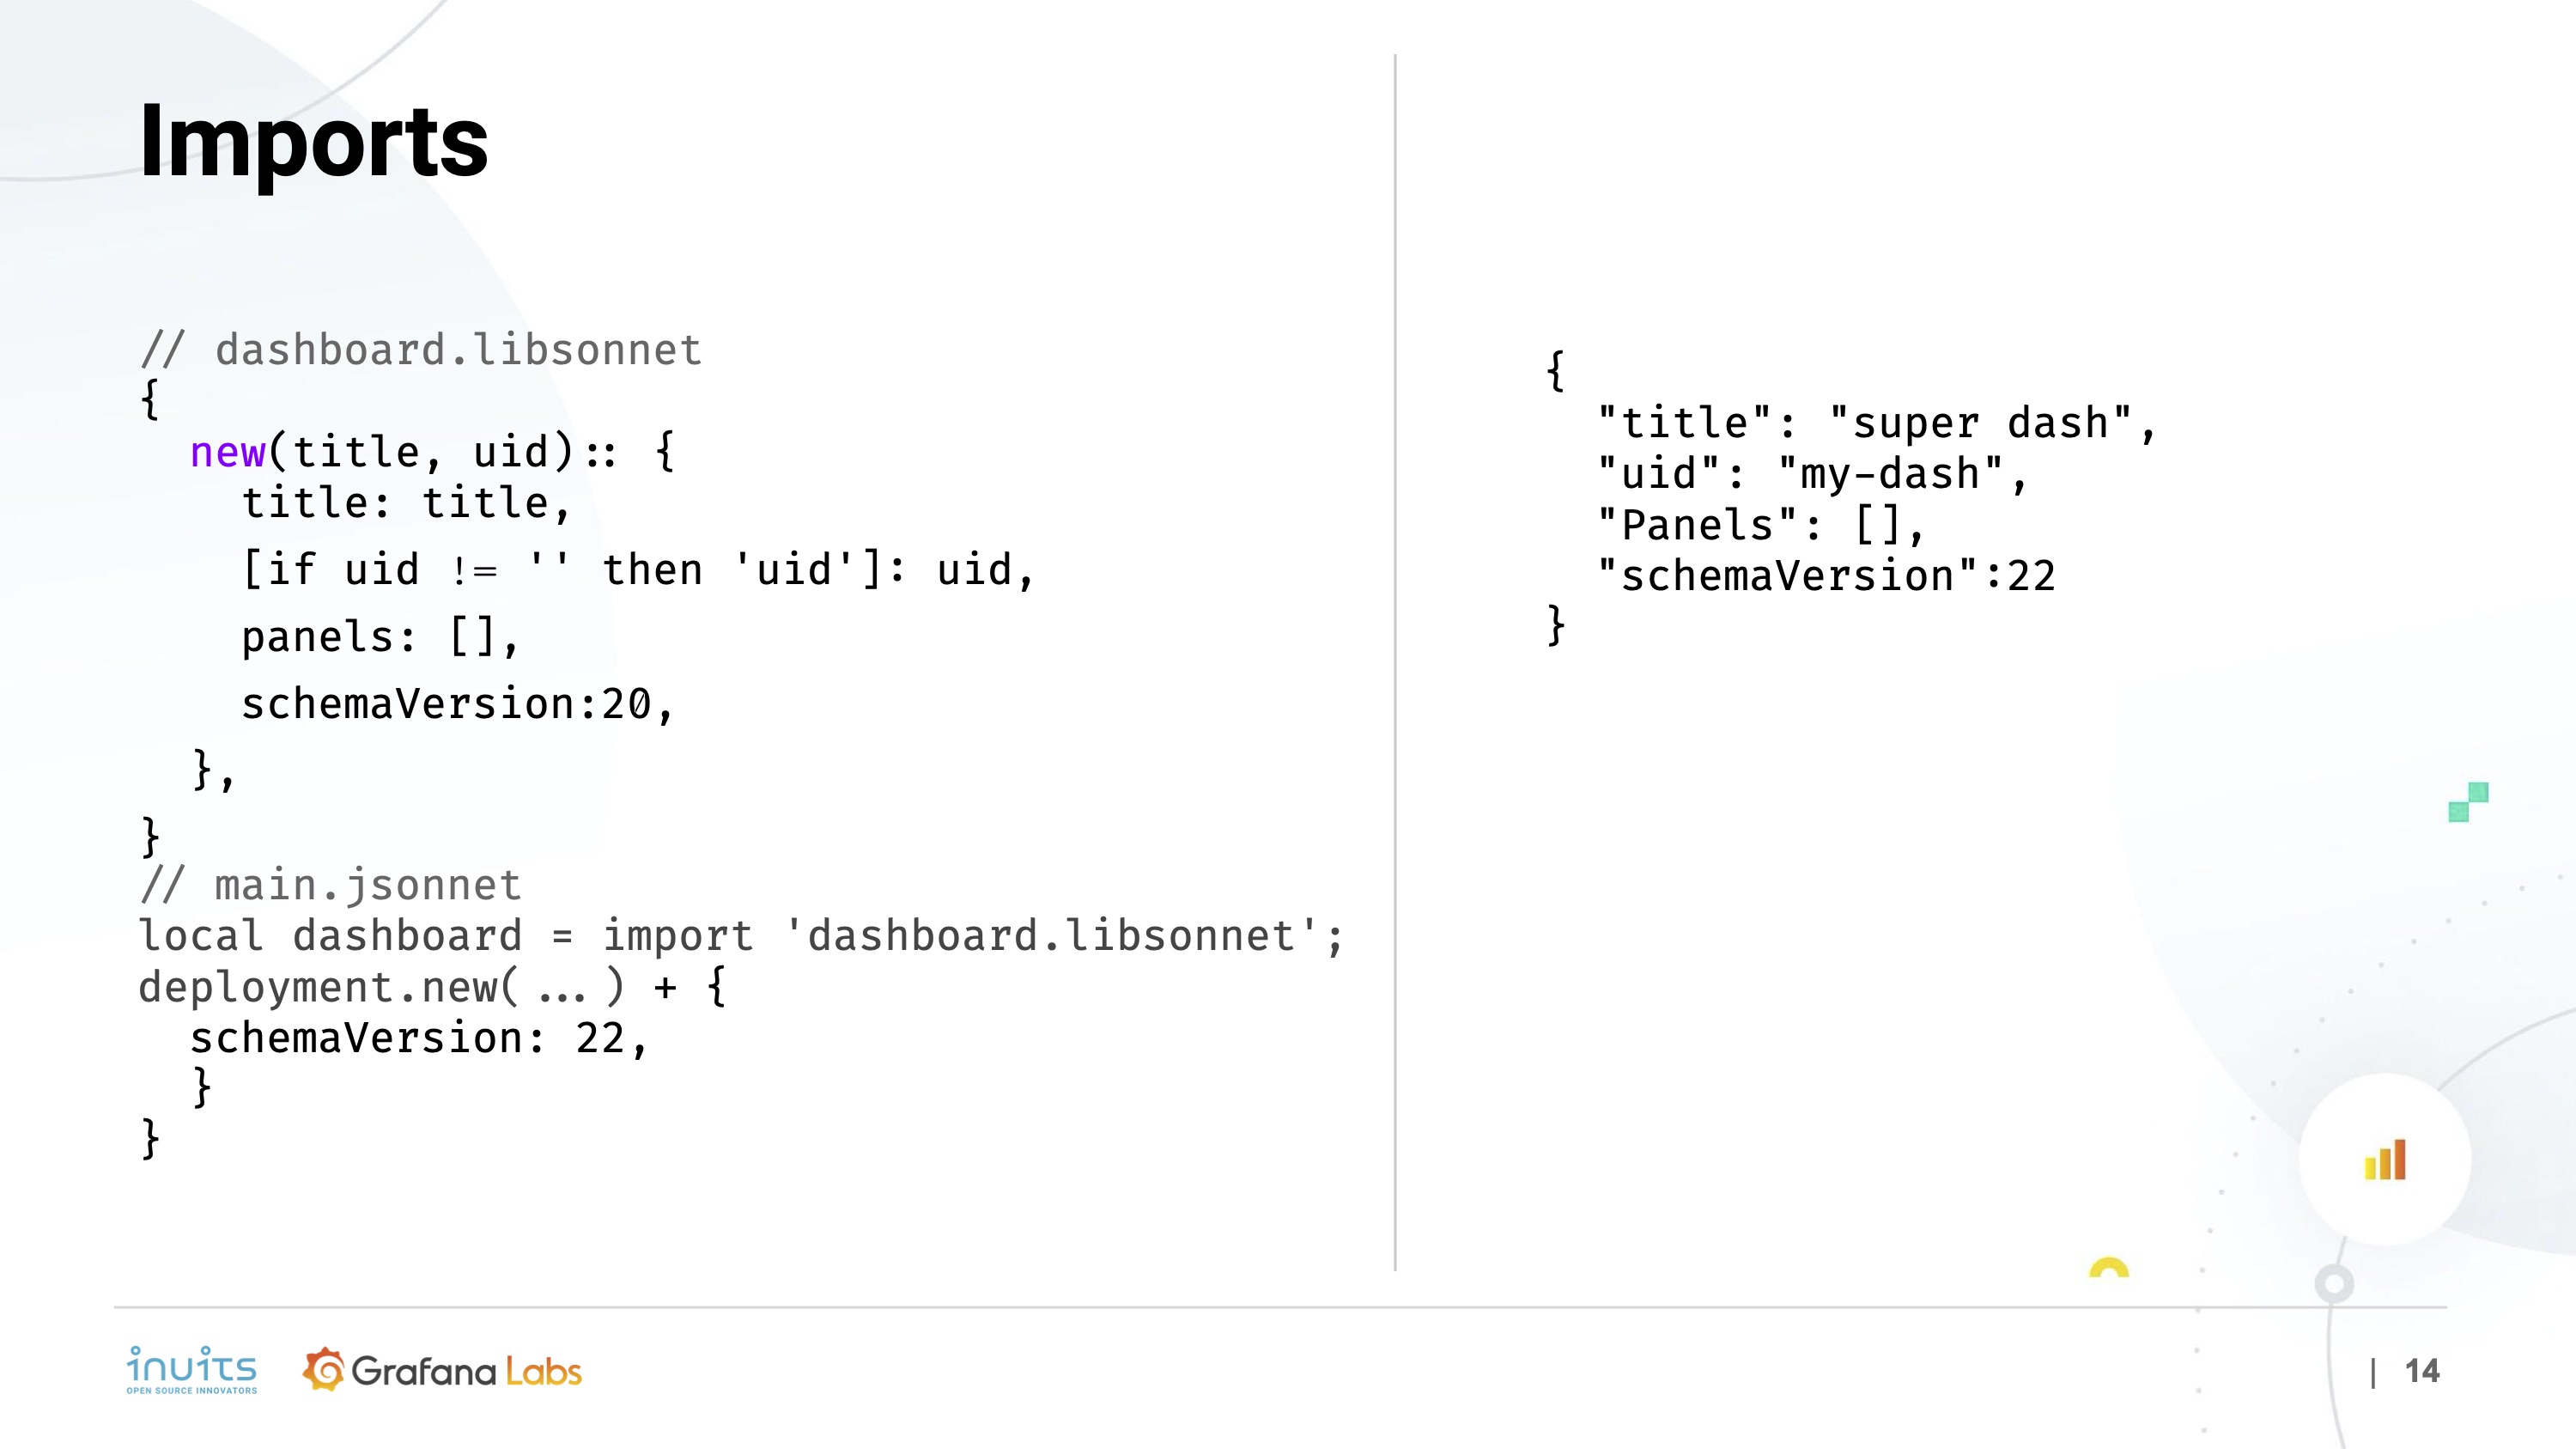
Not only can you create functions, but you also can put those functions into files.

In the above example, Holmes showed a new function being put into a file called dashboard.libsonnet. Then in main.jsonnet, he loaded that dashboard file into a local variable called dashboard, and called its new() method. Finally, he added schemaVersion: 22 and ended up with exactly the same end result JSON.
“So now we’ve decomposed our script into multiple files,” he said, “We may find — now that we’ve got the ability to create a dashboard — we could have a hundred of these scripts like this to create all of our many, many resulting dashboards.”
To take this one step further, Jsonnet has a tool called Jsonnet bundler, which Holmes said is “a bit like vendoring in golang. It can go and collect a Jsonnet library from GitHub or similar places, so you can interact with others in public about your dashboards and your resources, and that makes collaboration much more effective.”
Ready-to-use libraries
These are two helpful, existing libraries:
- https://github.com/grafana/grafonnet
- https://github.com/grafana/jsonnet-libs/tree/master/grafana-builder
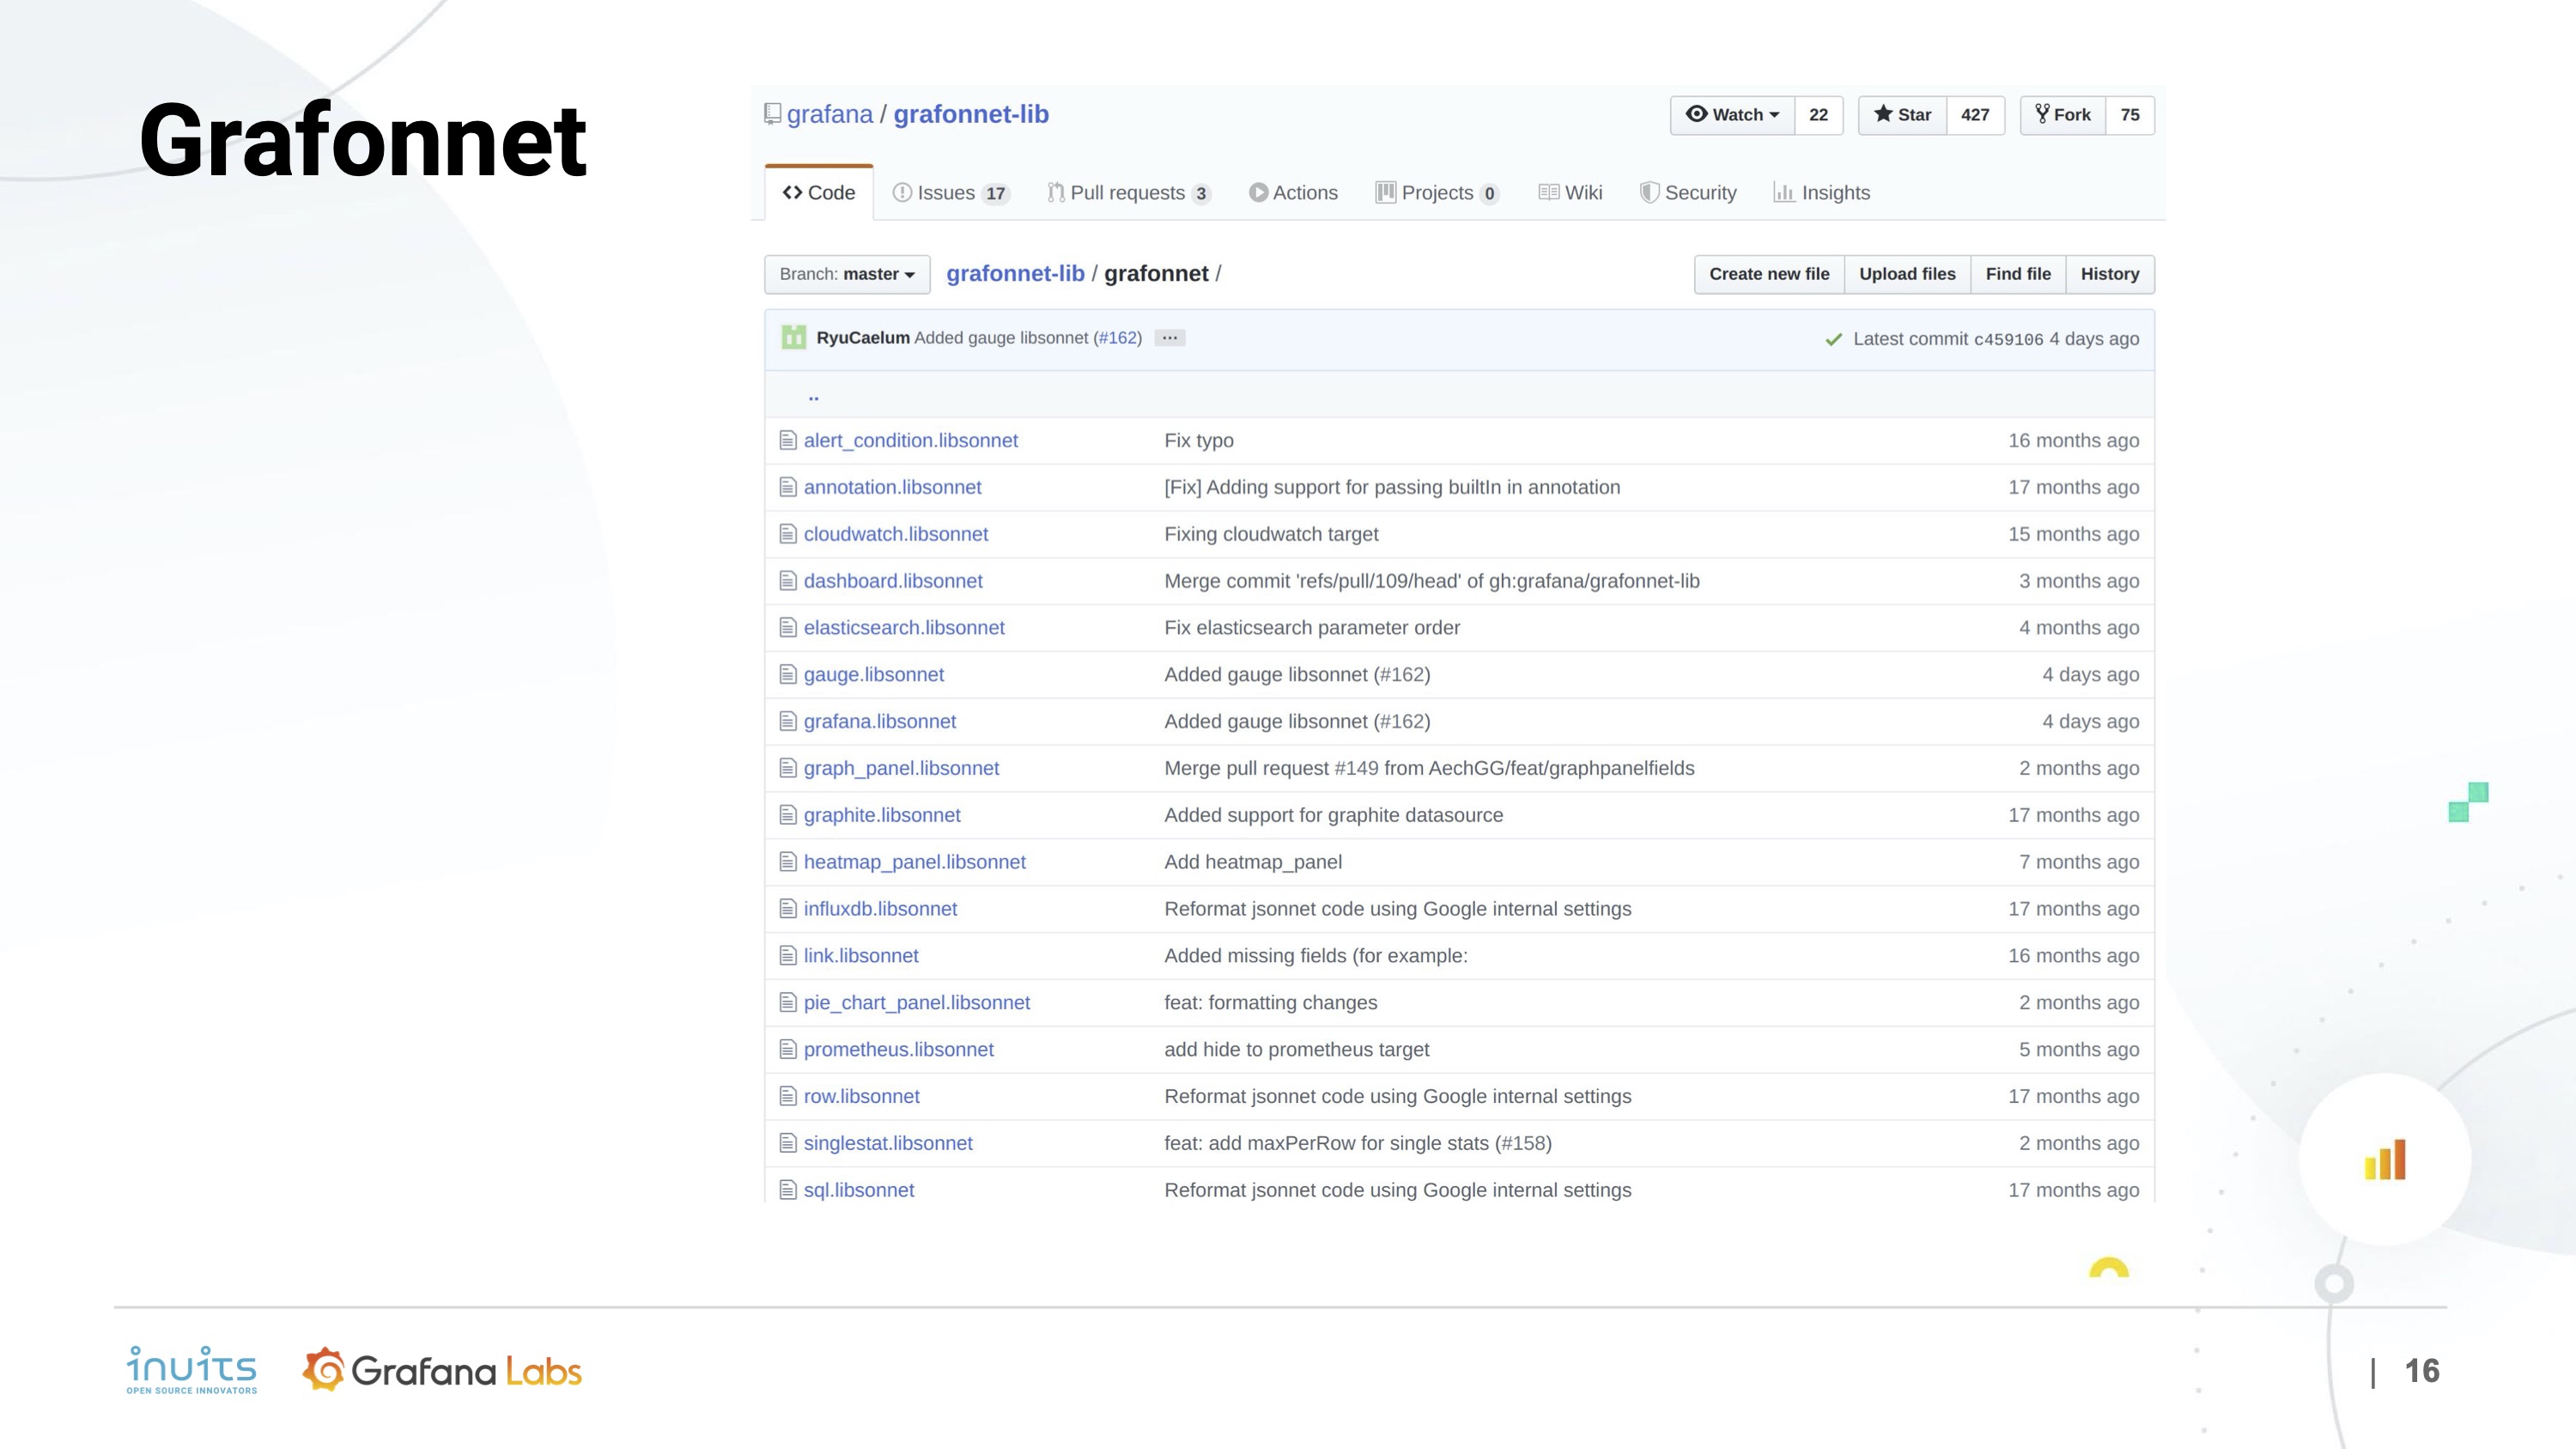
The prominent one, Grafonnet (which Holmes and Pivotto used in their demo), is a very simple library that provides you with the basics: creating a dashboard, creating a panel, creating a single stat panel, and so on.

The demo
The pair then gave a quick demo.
In it, they were able to create two very simple, reusable dashboards as well as reusable panels and reusable overrides – and they all looked the same.
“We did reuse 99 percent of the code between the two dashboards,” noted Pivotto. “So if you design it once and you want multiple teams to reuse it, even if you start to put colors — like I want to see the used space in red and the free space in green — you can use that with any kind of metrics to show exactly the same thing, and always in the same way.”
The future
There have been quite a few conversations at Grafana Labs about how we can make managing Grafana instances as code even better, Holmes said. We believe it has a lot of power, and the discussions have led to many ideas, such as: What if Grafana itself had native Jsonnet functionality, so you don’t run the Jsonnet to make JSON, you just pass up the Jsonnet?
“There are all sorts of interesting ideas there about how this could interact,” he explained — and it could be really easy. You have your applications in source control already, so with this, we could have prepackaged applications that have both the code and the dashboards and monitoring configuration embedded. That way, the dashboards (and everything that comes with them) would be traveling in the same way as the rest of your code. This is especially useful because people like to keep dashboards in version control and integration in a CI/CD pipeline, like the rest of their code.
Grafonnet is an open source project, and Holmes said that over the coming year or so, he expects the library will likely see accelerated development.
Grafana Cloud is the easiest way to get started with dashboards, metrics, logs, and traces. We have a generous free forever tier and plans for every use case. Sign up for free now!


