
Step-by-step guide to setting up Prometheus Alertmanager with Slack, PagerDuty, and Gmail
In my previous blog post, “How to explore Prometheus with easy ‘Hello World’ projects,” I described three projects that I used to get a better sense of what Prometheus can do. In this post, I’d like to share how I got more familiar with Prometheus Alertmanager and how I set up alert notifications for Slack, PagerDuty, and Gmail.
(I’m going to reference my previous blog post quite a bit, so I recommend reading it before continuing on.)
The basics
You can get started with Prometheus in minutes with Grafana Cloud. We have free and paid Grafana Cloud plans to suit every use case — sign up for free now.
Setting up alerts with Prometheus is a two-step process:
To start, you need to create your alerting rules in Prometheus, and specify under what conditions you want to be alerted (such as when an instance is down).
Second, you need to set up Alertmanager, which receives the alerts specified in Prometheus. Alertmanager will then be able to do a variety of things, including:
- grouping alerts of similar nature into a single notification
- silencing alerts for a specific time
- muting notifications for certain alerts if other specified alerts are already firing
- picking which receivers receive a particular alert
Step 1: Create alerting rules in Prometheus
We are starting with four subfolders that we’ve previously set up for each project: server, node_exporter, github_exporter, and prom_middleware. The process is explained in my blog post on how to explore Prometheus with easy projects here.
We move to server subfolder and open the content in the code editor, then create a new rules file. In the rules.yml, you will specify the conditions when you would like to be alerted.
cd Prometheus/server
touch rules.yml
I’m sure everyone agrees that knowing when any of your instances are down is very important. Therefore, I’m going to use this as our condition by using up metric. By evaluating this metric in the Prometheus user interface (http://localhost:9090), you will see that all running instances have value of 1, while all instances that are currently not running have value of 0 (we currently run only our Prometheus instance).
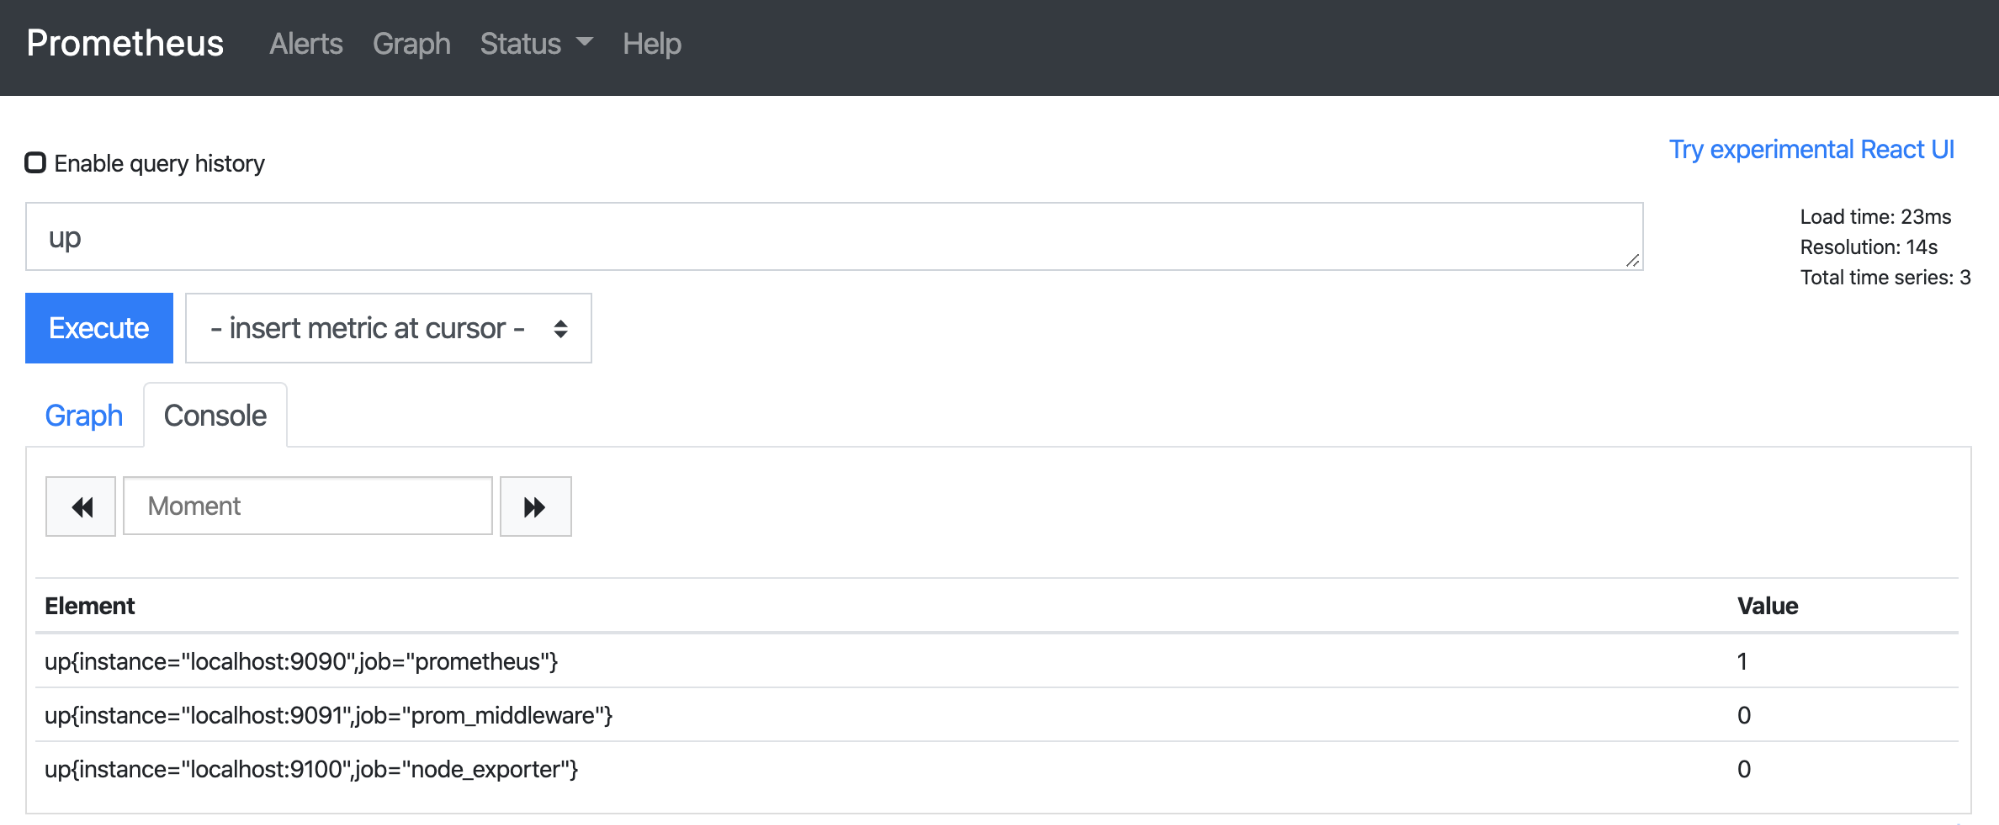
After you’ve decided on your alerting condition, you need to specify them in rules.yml. Its content is going to be the following:
groups:
- name: AllInstances
  rules:
  - alert: InstanceDown
    # Condition for alerting
    expr: up == 0
    for: 1m
    # Annotation - additional informational labels to store more information
    annotations:
      title: 'Instance {{ $labels.instance }} down'
      description: '{{ $labels.instance }} of job {{ $labels.job }} has been down for more than 1 minute.'
    # Labels - additional labels to be attached to the alert
    labels:
      severity: 'critical'
To summarize, it says that if any of the instances are going to be down (up == 0) for one minute, then the alert will be firing. I have also included annotations and labels, which store additional information about the alerts. For those, you can use templated variables such as {{ $labels.instance }} which are then interpolated into specific instances (such as localhost:9100).
(You can read more about Prometheus alerting rules here.)
Once you have rules.yml ready, you need to link the file to prometheus.yml and add alerting configuration. Your prometheus.yml is going to look like this:
global:
  # How frequently to scrape targets
  scrape_interval:     10s
  # How frequently to evaluate rules
  evaluation_interval: 10s

# Rules and alerts are read from the specified file(s)
rule_files:
  - rules.yml

# Alerting specifies settings related to the Alertmanager
alerting:
  alertmanagers:
    - static_configs:
      - targets:
        # Alertmanager's default port is 9093
        - localhost:9093

# A list of scrape configurations that specifies a set of
# targets and parameters describing how to scrape them.
scrape_configs:
  - job_name: 'prometheus'
    scrape_interval: 5s
    static_configs:
      - targets:
        - localhost:9090
  - job_name: 'node_exporter'
    scrape_interval: 5s
    static_configs:
      - targets:
        - localhost:9100
  - job_name: 'prom_middleware'
    scrape_interval: 5s
    static_configs:
      - targets:
        - localhost:9091
If you’ve started Prometheus with --web.enable-lifecycle flag, you can reload configuration by sending POST request to /-/reload endpoint curl -X POST http://localhost:9090/-/reload. After that, start prom_middleware app (node index.js in prom_middleware folder) and node_exporter (./node_exporter in node_exporter folder).
Once you do this, anytime you want to create an alert, you can just stop the node_exporter or prom_middleware app.
Step 2: Set up Alertmanager
Create an alert_manager subfolder in the Prometheus folder, mkdir alert_manager. To this folder, you’ll then download and extract Alertmanager from the Prometheus website, and without any modifications to the alertmanager.yml, you’ll run ./alertmanager --config.file=alertmanager.yml and open localhost:9093.
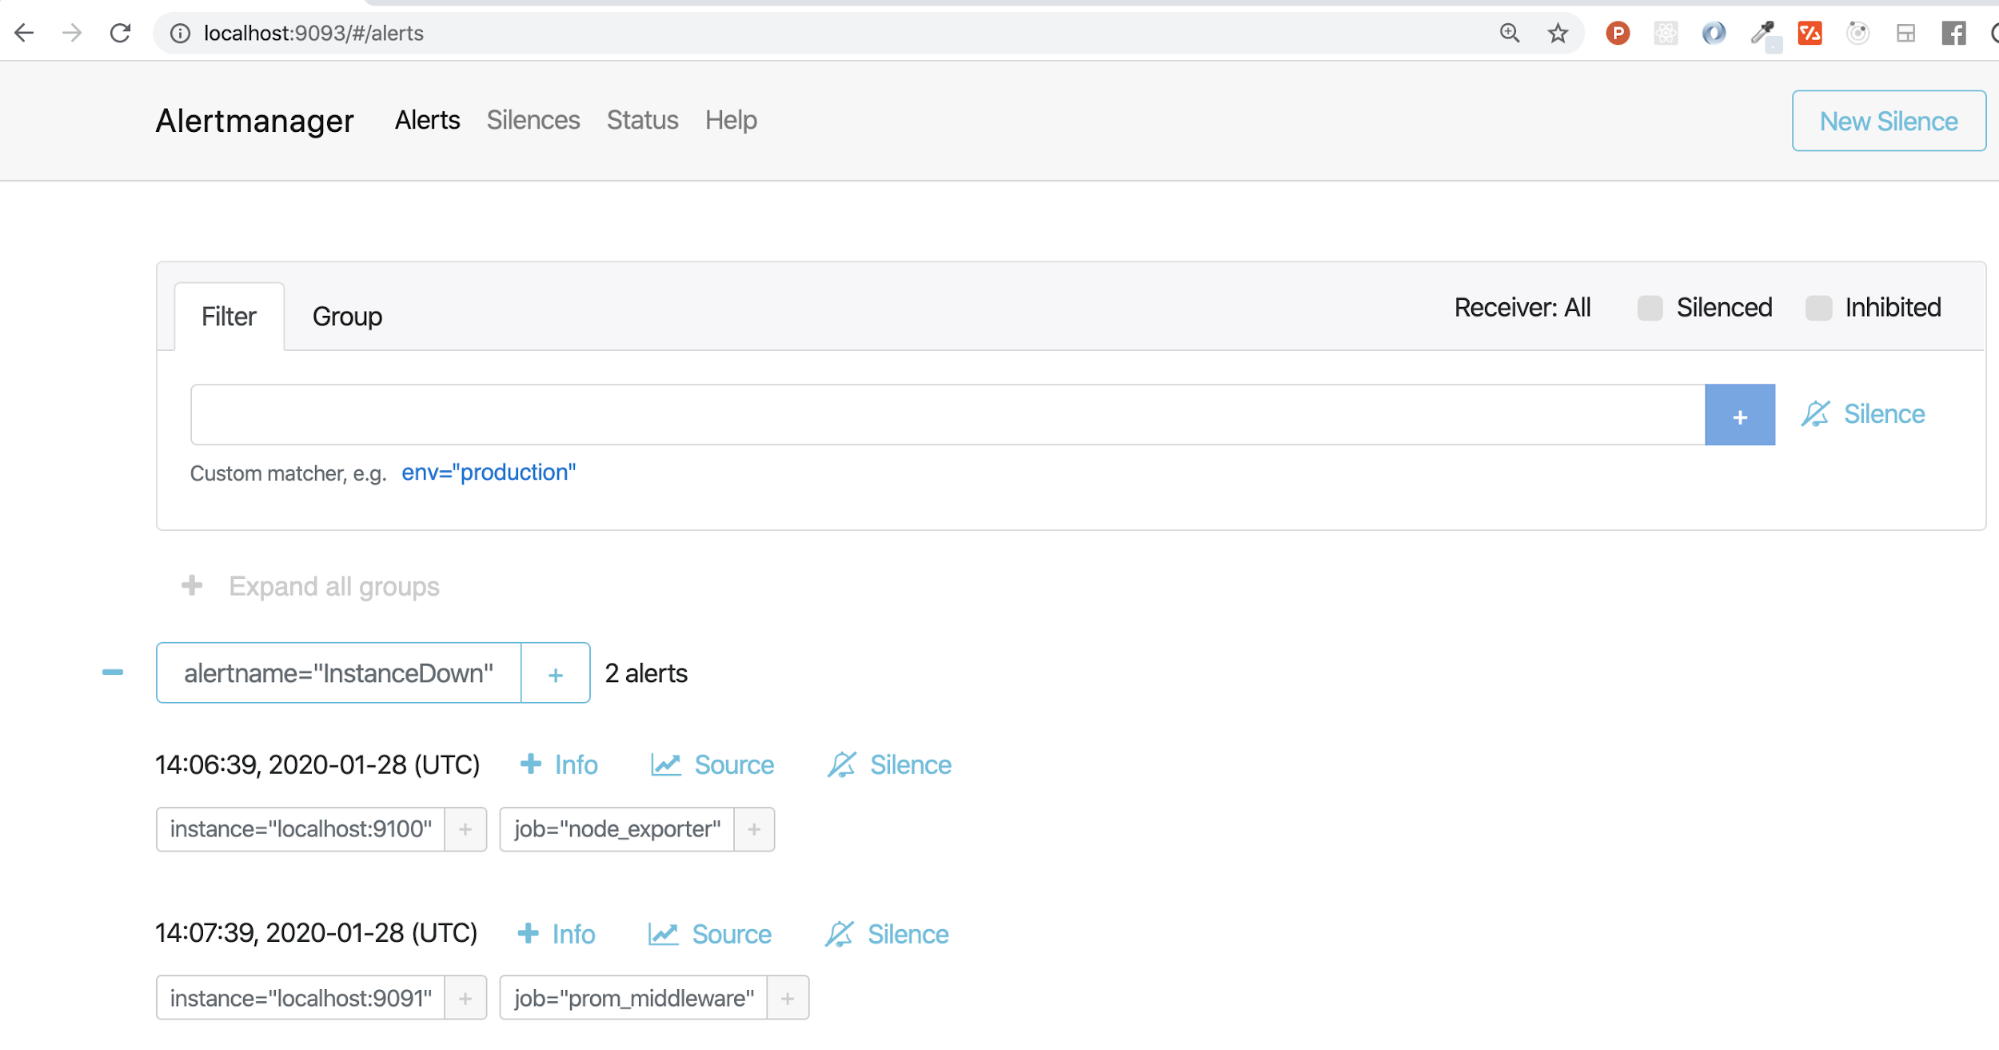
Depending on whether or not you have any active alerts, Alertmanager should be properly set up and look something like the image below. To see the annotations that you added in the step above, you’d click on the +Info button.
With all of that completed, we can now look at the different ways of utilizing Alertmanager and sending out alert notifications.
How to set up Slack alerts
If you want to receive notifications via Slack, you should be part of a Slack workspace. If you are currently not a part of any Slack workspace, or you want to test this out in separate workspace, you can quickly create one here.
To set up alerting in your Slack workspace, you’re going to need a Slack API URL. Go to Slack -> Administration -> Manage apps.
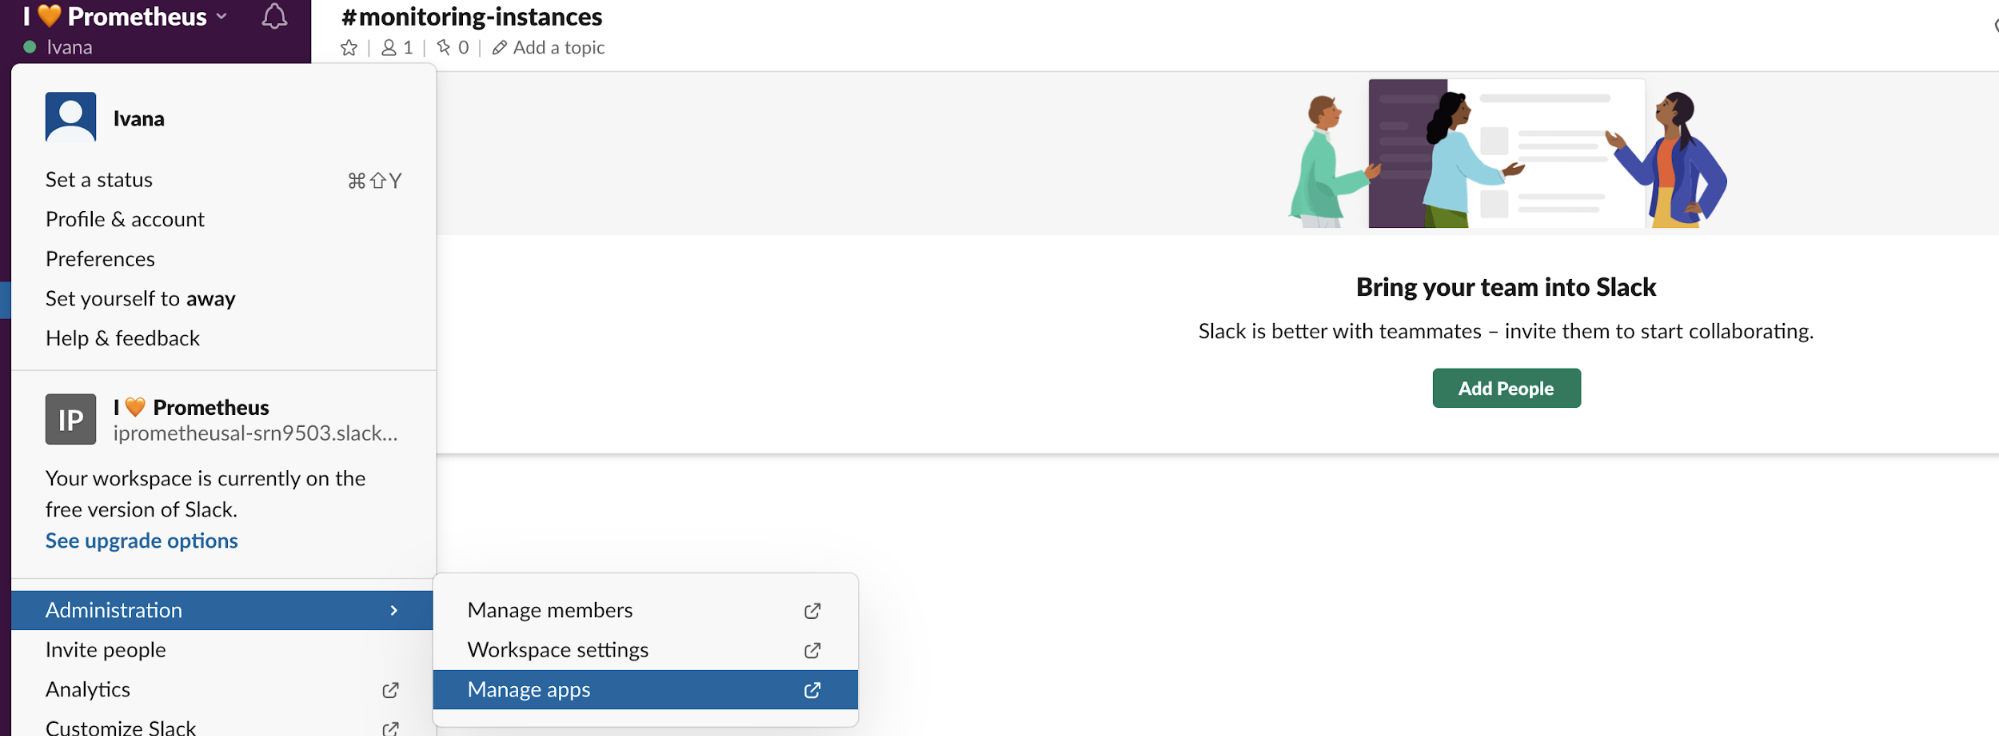
In the Manage apps directory, search for Incoming WebHooks and add it to your Slack workspace.

Next, specify in which channel you’d like to receive notifications from Alertmanager. (I’ve created #monitoring-infrastructure channel.) After you confirm and add Incoming WebHooks integration, webhook URL (which is your Slack API URL) is displayed. Copy it.

Then you need to modify the alertmanager.yml file. First, open subfolder alert_manager in your code editor and fill out your alertmanager.yml based on the template below. Use the url that you have just copied as slack_api_url.
global:
  resolve_timeout: 1m
  slack_api_url: 'https://hooks.slack.com/services/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'

route:
  receiver: 'slack-notifications'

receivers:
- name: 'slack-notifications'
  slack_configs:
  - channel: '#monitoring-instances'
    send_resolved: true
Reload configuration by sending POST request to /-/reload endpoint curl -X POST http://localhost:9093/-/reload. In a couple of minutes (after you stop at least one of your instances), you should be receiving your alert notifications through Slack, like this:

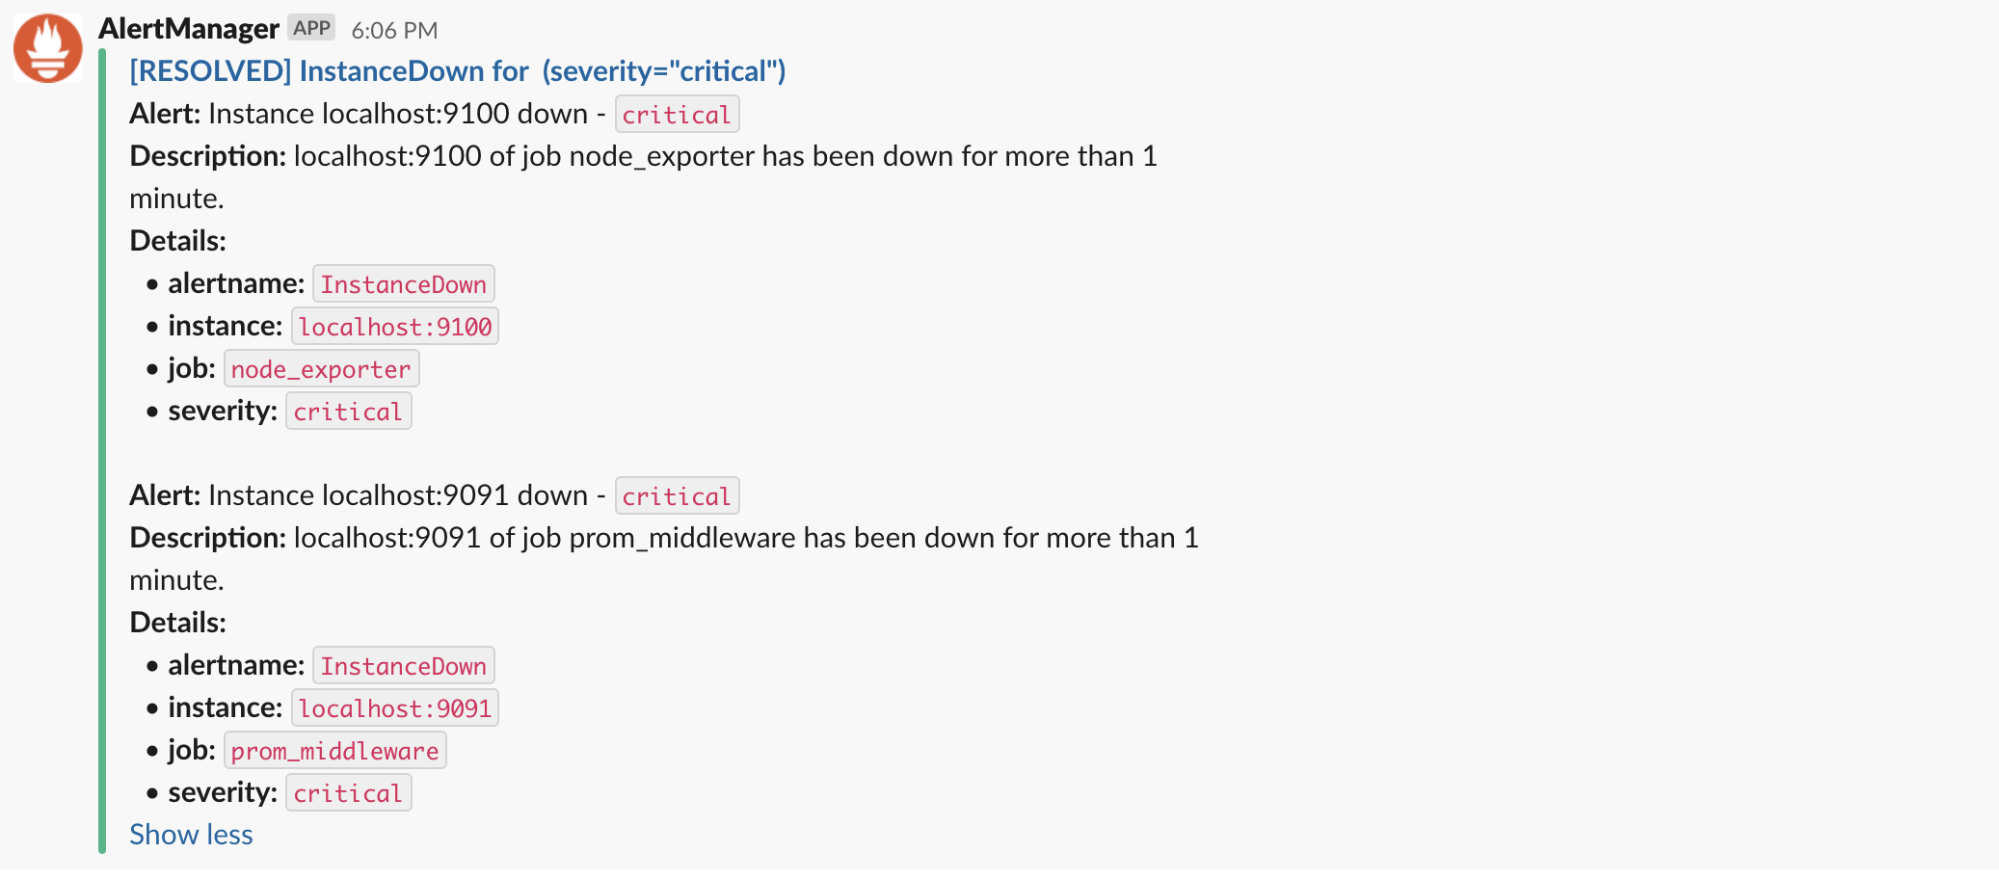
If you would like to improve your notifications and make them look nicer, you can use the template below, or use this tool and create your own.
global:
  resolve_timeout: 1m
  slack_api_url: 'https://hooks.slack.com/services/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'

route:
  receiver: 'slack-notifications'

receivers:
- name: 'slack-notifications'
  slack_configs:
  - channel: '#monitoring-instances'
    send_resolved: true
    icon_url: https://avatars3.githubusercontent.com/u/3380462
    title: |-
     [{{ .Status | toUpper }}{{ if eq .Status "firing" }}:{{ .Alerts.Firing | len }}{{ end }}] {{ .CommonLabels.alertname }} for {{ .CommonLabels.job }}
     {{- if gt (len .CommonLabels) (len .GroupLabels) -}}
       {{" "}}(
       {{- with .CommonLabels.Remove .GroupLabels.Names }}
         {{- range $index, $label := .SortedPairs -}}
           {{ if $index }}, {{ end }}
           {{- $label.Name }}="{{ $label.Value -}}"
         {{- end }}
       {{- end -}}
       )
     {{- end }}
    text: >-
     {{ range .Alerts -}}
     *Alert:* {{ .Annotations.title }}{{ if .Labels.severity }} - `{{ .Labels.severity }}`{{ end }}

     *Description:* {{ .Annotations.description }}

     *Details:*
       {{ range .Labels.SortedPairs }} • *{{ .Name }}:* `{{ .Value }}`
       {{ end }}
     {{ end }}
And this is the final result:
How to set up PagerDuty alerts
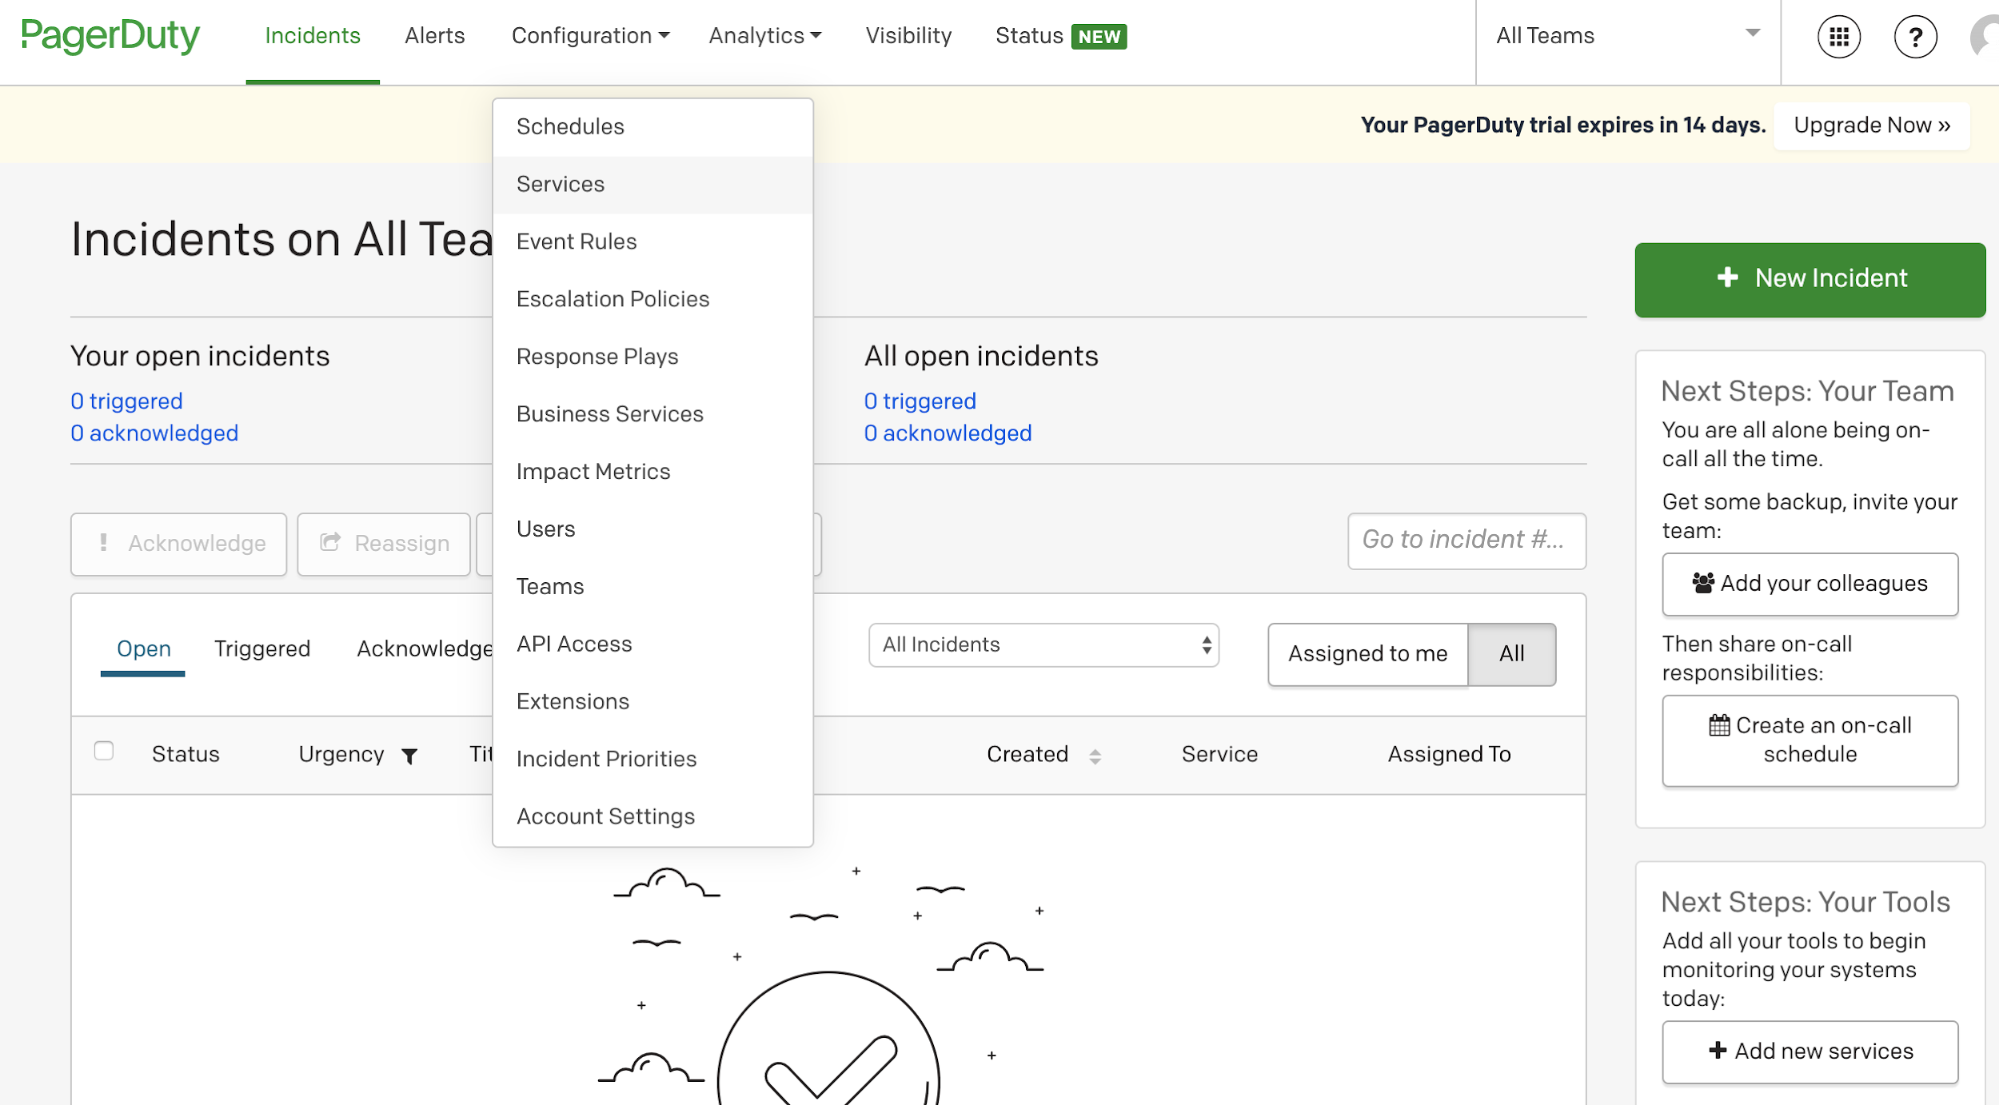
PagerDuty is one of the most well-known incident response platforms for IT departments. To set up alerting through PagerDuty, you need to create an account there. (PagerDuty is a paid service, but you can always do a 14-day free trial.) Once you’re logged in, go to Configuration -> Services -> + New Service.
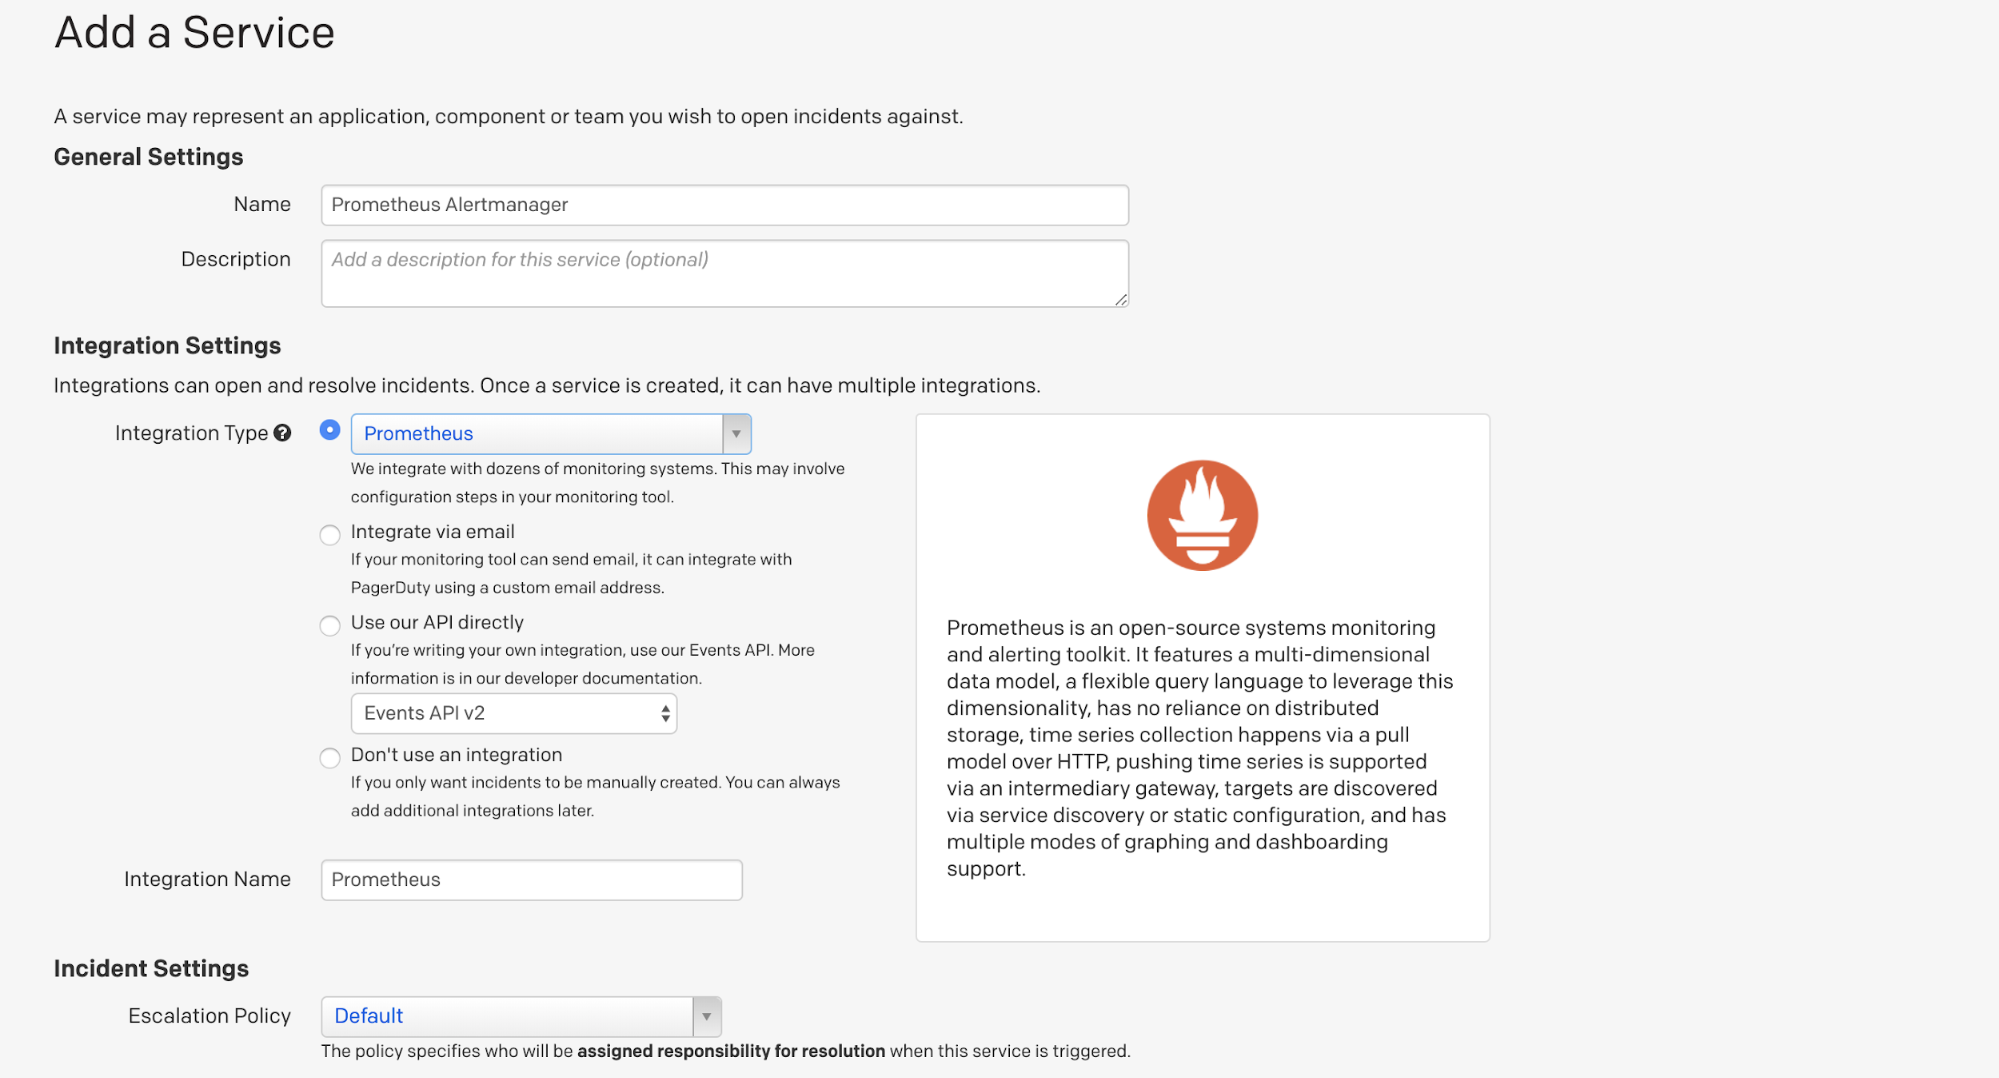
Choose Prometheus from the Integration types list and give the service a name. I decided to call mine Prometheus Alertmanager. (You can also customize the incident settings, but I went with the default setup.) Then click save.
The Integration Key will be displayed. Copy the key.

You’ll need to update the content of your alertmanager.yml. It should look like the example below, but use your own service_key (integration key from PagerDuty). Pagerduty_url should stay the same and should be set to https://events.pagerduty.com/v2/enqueue. Save and restart the Alertmanager.
global:
  resolve_timeout: 1m
  pagerduty_url: 'https://events.pagerduty.com/v2/enqueue'

route:
  receiver: 'pagerduty-notifications'

receivers:
- name: 'pagerduty-notifications'
  pagerduty_configs:
  - service_key: 0c1cc665a594419b6d215e81f4e38f7
    send_resolved: true
Stop one of your instances. After a couple of minutes, alert notifications should be displayed in PagerDuty.
In PagerDuty user settings, you can decide how you’d like to be notified: email and/or phone call. I chose both and they each worked successfully.
How to set up Gmail alerts
If you prefer to have your notifications come directly through an email service, the setup is even easier. Alertmanager can simply pass along messages to your provider — in this case, I used Gmail — which then sends them on your behalf.
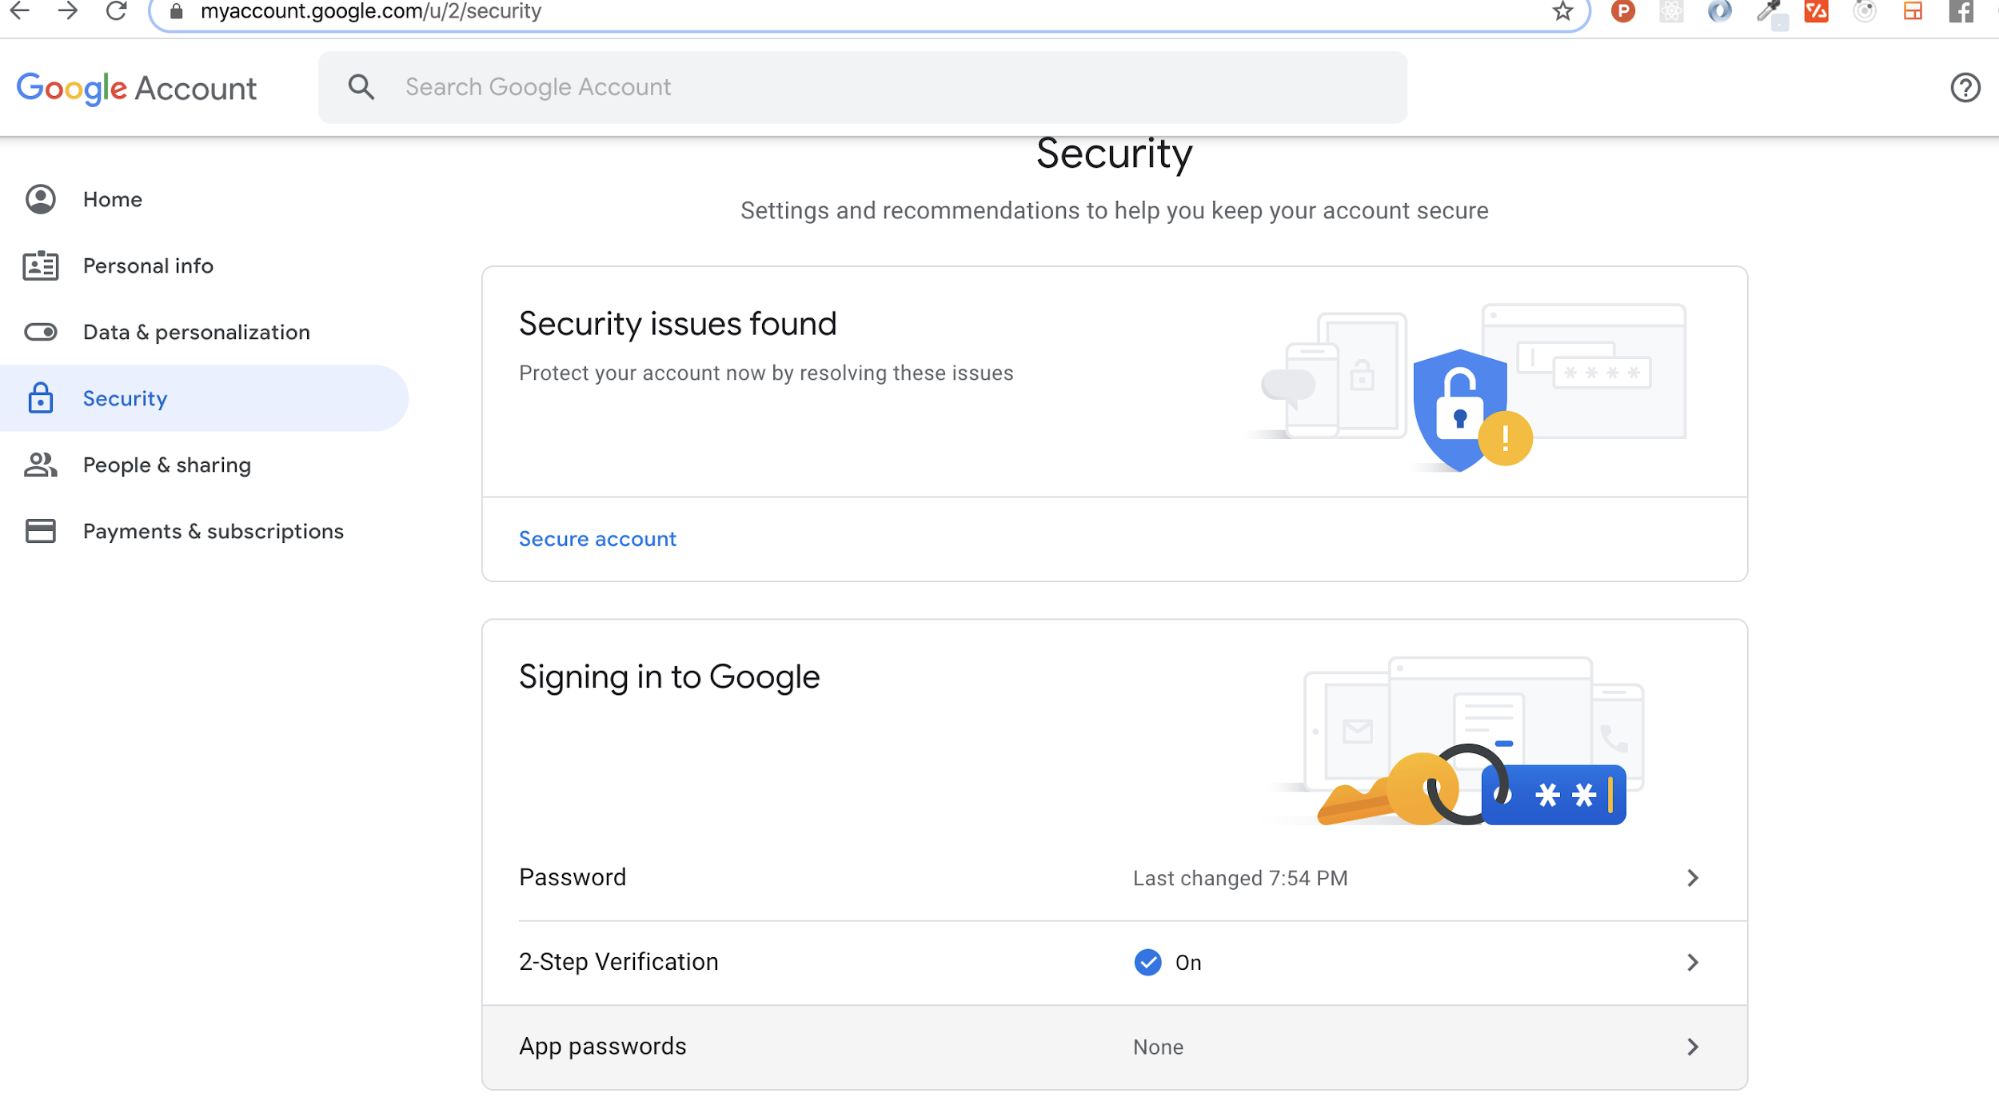
It isn’t recommended that you use your personal password for this, so you should create an App Password. To do that, go to Account Settings -> Security -> Signing in to Google -> App password (if you don’t see App password as an option, you probably haven’t set up 2-Step Verification and will need to do that first). Copy the newly created password.
You’ll need to update the content of your alertmanager.yml again. The content should look similar to the example below. Don’t forget to replace the email address with your own email address, and the password with your new app password.
global:
  resolve_timeout: 1m

route:
  receiver: 'gmail-notifications'

receivers:
- name: 'gmail-notifications'
  email_configs:
  - to: monitoringinstances@gmail.com
    from: monitoringinstances@gmail.com
    smarthost: smtp.gmail.com:587
    auth_username: monitoringinstances@gmail.com
    auth_identity: monitoringinstances@gmail.com
    auth_password: password
    send_resolved: true
Once again, after a couple of minutes (after you stop at least one of your instances), alert notifications should be sent to your Gmail.

And that’s it!


