Connecting Prometheus-Ksonnet to Grafana Cloud
In a previous post we showed how to install Prometheus and Grafana using the prometheus-ksonnet library along with Tanka. This is great for getting a well-managed monitoring install going, but sometimes it isn’t enough for monitoring larger clusters.
If you have multiple clusters that you want to monitor on a single dashboard, or need long-term storage, or need a high-availability setup for your monitoring data, then this installation won’t be sufficient on its own.
Fortunately, the Grafana Cloud Hosted Prometheus product offered by Grafana Labs solves all of these problems: It supports long-term storage, can receive metrics from multiple clusters, and is fundamentally designed to support high availability.
And it’s simple to connect Prometheus-Ksonnet to Grafana Cloud. This blog post will show you how.
Step-by-step instructions
Log into or create an account on grafana.com.
![Grafana.com Login Grafana.com Login]()
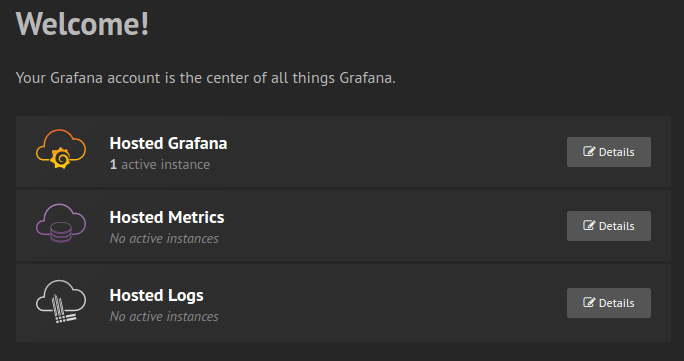
Grafana.com Login Click “Hosted Metrics.”
![Hosted Metrics Hosted Metrics]()
Hosted Metrics Click “Create Hosted Metrics Instance.”
![Create Hosted Metrics Instance Create Hosted Metrics Instance]()
Create Hosted Metrics Instance Choose a name, select backend type
Prometheus, then click “Create Hosted Metrics Instance.”You will now need to note a few configuration values that we will reuse later. Under “Grafana Data Source settings”: *Grab the URL. It will end with
/api/prom. *Take note of youruser ID(which will be a number). *Where it sayspassword, click “Generate now.”![Create an API Key Create an API Key]()
Create an API Key Give this key a name (e.g.
prometheus-ksonnet), choose a role ofEditorViewer, and click “Create API Key.”![API Key Created API Key Created]()
API Key Created You will be shown an API key. Make note of this. (Don’t worry; the keys shown in the screenshots are not valid.)
![Code for Prometheus Config Code for Prometheus Config]()
Code for Prometheus Config Under the section “Sending Data to Prometheus,” you will see a snippet of YAML. Grab the URL from that YAML. It will end
/api/prom/push.Now edit your
environments/default/main.jsonnet.It should look like this, but with your own URLs, user ID, and api key in place of these samples:
local prometheus = import 'prometheus-ksonnet/prometheus-ksonnet.libsonnet';

prometheus {
  _config+:: {
    namespace: "default",
    cluster_name: "grafana",
    prometheus: {
      cluster: 'my-cluster',
      read_url: 'https://prometheus-us-central1.grafana.net/api/prom',
      write_url: 'https://prometheus-us-central1.grafana.net/api/prom/push',
      user: '10449',
      key: 'eyJrIjoiZTc2MzViYjk5MWQ4ZjgyN2Y4NDQwYTVhMGQ4OTZlZjhhNjUxZjJkOCIsIm4iOiJwcm9tZXRoZXVzLWtzb25uZXQiLCJpZCI6MTgxMDcxfQ==',
    },
  },
  prometheus_config+:: {
    global: { external_labels: {cluster: $._config.prometheus.cluster} },
    remote_write+: [
      {
        url: $._config.prometheus.write_url,
        basic_auth: {
          username: $._config.prometheus.user,
          password: $._config.prometheus.key,
        },
      },
    ],
  },
  grafana_datasource_config_map+:
    $.grafana_add_datasource_with_basicauth(
      'grafana-cloud',
      $._config.prometheus.read_url,
      $._config.prometheus.user,
      $._config.prometheus.key),
}
Here, you will see we have added values to configuration. We have added a remote write configuration to Prometheus so that it can find and write to Grafana Cloud, and we have added a data source to our Grafana instance. As well as this, we have added an external label to our Prometheus metrics that names our cluster. This means that we can distinguish metrics coming from separate clusters. We can use a template on our dashboards to allow us to change between clusters.
With this Grafana instance, we can now query our local Prometheus within our cluster, and we can also query the Grafana Cloud Hosted Prometheus instance. If this contains data regarding other clusters, we can access that data from any of our Grafana instances.
Interested in learning more?
To find out if Grafana Cloud – the highly available, fast, fully managed logging and metrics platform – is right for your organization, read more about it here.
Ready to try it now?


