ICYMI: The 10 Most-Read Blog Posts of 2019
As 2019 comes to a close, we’re looking back at the 10 most-read blog posts of the year. (We’re not including the also-popular release posts in this list.) Here’s another chance to check them out in case you missed them the first time around.
1. How a Production Outage Was Caused Using Kubernetes Pod Priorities
In this post, Tom Wilkie explained what happened during an outage in Grafana Labs’ Hosted Prometheus service, how the team responded to it, and what they’re doing to ensure it doesn’t happen again.
2. Sneak Preview of New Visualizations Coming to Grafana
Grafana creator Torkel Ödegaard offered his thoughts on – and some interesting inspirations for – the new visualizations that were introduced in v6.2.

3. A Look Inside GitLab’s Public Dashboards
There are transparent companies – and then there’s GitLab. This recap of a GrafanaCon talk covers what the company monitors and how it’s visualized.
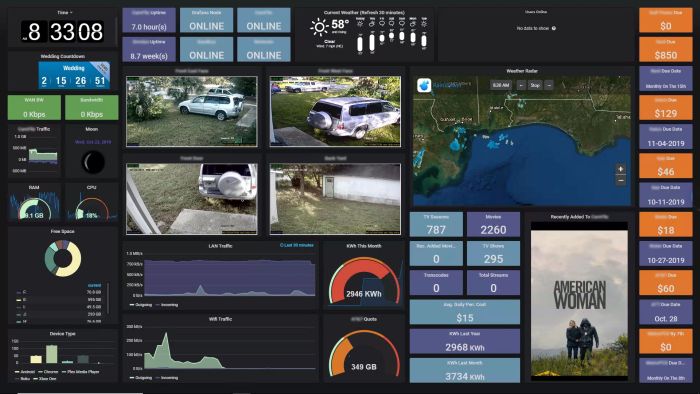
4. How to Set Up This Next-Level Personal Home Dashboard in Your Kitchen
Guest blogger Cameron McCloskey shared a complete how-to for the awesome Grafana dashboard he created for his home.

5. Worth a Look: Public Grafana Dashboards
Wikimedia, CERN, and Cloud Native Computing Foundation are just a few of the organizations that make their Grafana dashboards public. Check out more here.
6. Grafana Tutorial: How to Create Kiosks to Display Dashboards on a TV
Here’s a step-by-step guide to get your Grafana dashboards and playlists displayed on a large TV – a perfect project for your holiday break.
7. How We Designed Loki to Work Easily Both as Microservices and as Monoliths
The Loki team discussed how the project incorporated the best of both worlds, making it much simpler to use, whether you want to run a single process on bare metal or microservices at hyperscale.
8. A Closer Look at Grafana’s User Interface for Loki
David Kaltschmidt broke down the UX goals that went into designing Loki. “It is designed to be lean in the backend,” he wrote. “In addition, we tried to pair this with a clean and intuitive way to read your logs inside Grafana.”
9. How Not to Fail at Visualization
At GrafanaCon L.A., Icinga CPO Blerim Sheqa gave a talk about best practices for visualization.
10. What $24 Million Means for Our Open Source Community
After Grafana Labs announced it had raised Series A funding, CEO Raj Dutt addressed the company’s commitment to investing even more in the open source project and pushing forward with the vision of building an open, composable observability platform. “We’re staying true to our roots while reimagining what’s possible,” he wrote.


