![[KubeCon Recap] Configuring Cortex for Maximum Performance at Scale](/static/assets/img/blog/cortex_kubecon4.jpg?w=752)
[KubeCon Recap] Configuring Cortex for Maximum Performance at Scale
In this KubeCon + CloudNativeCon session last month, Grafana Labs Software Engineer Goutham Veeramachaneni offered a deep dive into how to make sure your Cortex will scale with your usage. Or as he put it: “every way we DDoS-ed our Cortex.”
Veeramachaneni – who is a maintainer for both Prometheus and Cortex, and also co-authored Loki – pointed out that since “Loki is also built on top of Cortex, whatever I’m saying for Cortex also applies to Loki.”
For the past year and a half, he said, pointing to a diagram of Cortex architecture, “I’ve been on call for this beast.” And, he added, what he’s learned is that it’s “quite easy to tame.”
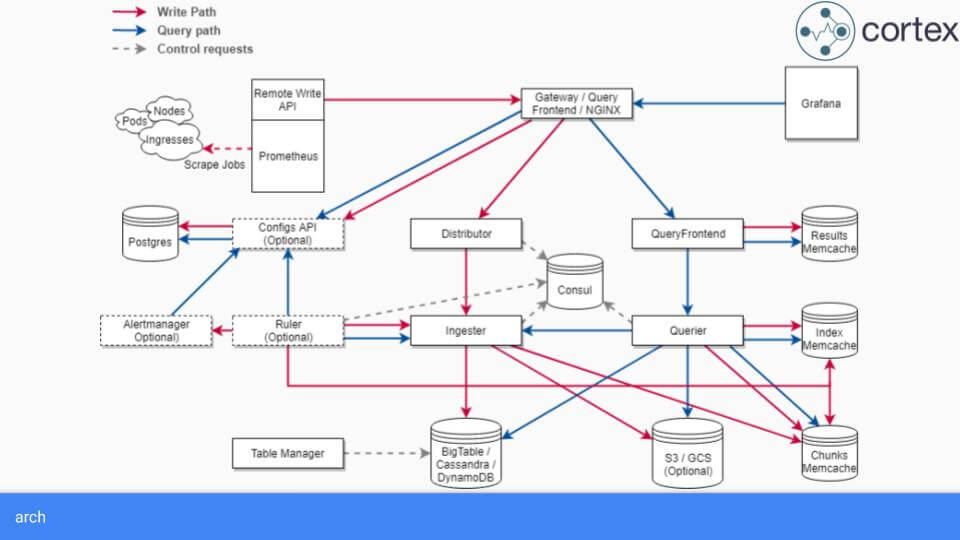
That’s largely because of Cortex’s configurability. ./cortex --help prints 1,005 lines, with about 500 flags. “This means you can tune every single piece of Cortex individually,” he said. “We have a bunch of composable components.” For example, Cortex has a caching component that has support for memcache, redis, and an in-memory cache. This single component has 20 flags to configure everything including the expiry of elements. This cache is used in at least 5 different places, causing 100 flags for just the cache component.
Veeramachaneni spent the rest of the talk breaking down how to configure Cortex for scale.
The Write Path
In the write path, Prometheus writes to the gateway, which does authentication, adds the tenant ID and tenant header, then sends it to the distributor. The distributor sends it to the ingestor. The ingestor takes the individual samples, builds them up into bigger chunks, and then writes them into BigTable, GCS, and the cache.
Writes Dashboard
Imagine you’re operating Cortex, and you get paged because the writes are failing, or the Prometheus remote write is falling behind because it can’t write fast enough. What do you do? “This is my playbook for being on call for Cortex,” he said. “I get paged for writes. I go to something called the Cortex writes dashboard.”
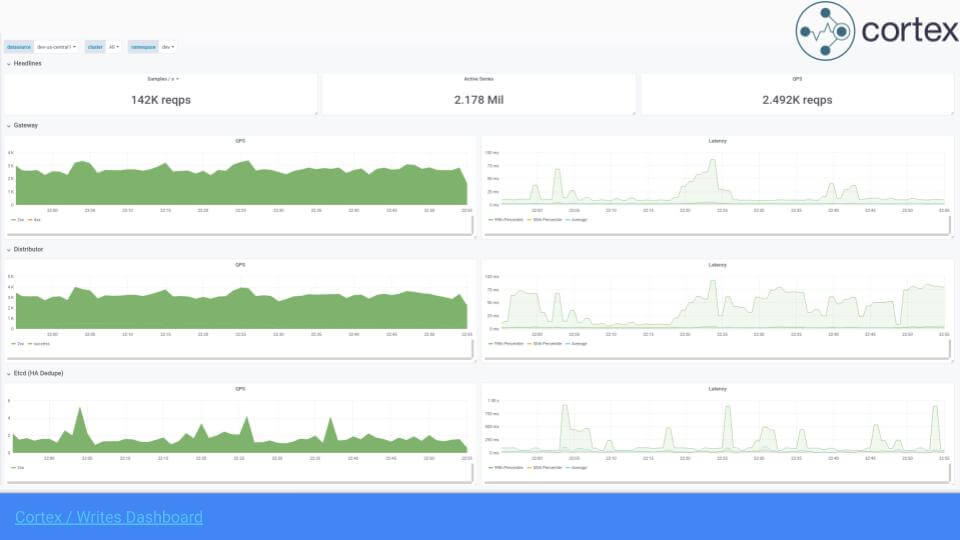
This dashboard, which has been open sourced, is based on the RED method of how to instrument distributed applications, especially if they are RPC systems. You need to track Requests, Errors, and Duration. “If you have distributed systems, you can build these very consistent templated RED dashboards that will actually give you at one glance what is wrong with your system and what is right with your system,” said Veeramachaneni.
Cortex, he explained, “is like a tiered application where A talks to B, talks to C, talks to D, and [on the dashboard] you have the QPS on the left and latency on the right. The beauty of this is if something goes red, for example, you see the gateway is red: 500 errors are being thrown, distributor is red. But the ingestor is green. So immediately you can understand the distributor is what is throwing these errors, and that you need to look at the distributor logs, not the ingestor logs.”
The same would apply for latency. If there’s, say, a 40-millisecond latency on writes, and you see that the ingestor only has a 5-millisecond latency, that means that the distributor is what is adding the latency.
Scaling Dashboard
When the company signed up its first customers for Cortex as a service, Veeramachaneni found that things started to slow down because he hadn’t scaled it up enough. So they built a scaling dashboard for workload-based scaling and resource-based scaling.

In this example of the resource-based scaling dashboard, “essentially there are 12 replicas, but if you look at the CPU usage and CPU requests, you need 30 replicas,” said Veeramachaneni. “So I can just take a take one look at this dashboard and know exactly what is wrong here.”
With workload-based scaling, he said, “the ingestor component stores the most recent 6 to 12 hours of data. So essentially you send all the samples to the ingestor, it batches them into 6-hour chunks, and writes the chunk to BigTable or DynamoDB just to reduce rate amplification and to have compression and everything. We limit the number of active series an ingestor can do because we notice that regardless of 6 hours or 12 hours, the memory being used when ingested is dependent on the number of active series it has, and we limit the amount of active series to 1 to 1.5 million series.”
Veeramachaneni cautioned that those limits should be dependent on your use case. Also, if the ingestor has too many series, there will be some added latency to queries; with fewer series, the queries will be faster. Be aware of the tradeoffs. “You need to get comfortable with the number and then stick to that number,” he said. “Bryan from Weaveworks runs the Cortex with 4 million series with 64 GB RAM, while we run it at 1 million series with 16 GB RAM.”
One thing to note is that the ingester component cannot be auto-scaled right now, but it should be possible quite soon, when this PR is merged.
Best Practices
First and foremost, create alerts for everything, and then make sure that you can scale along with usage.
More specifically, here are some best practices used at Grafana Labs:
1. Cache the most recent two days of data in memcached. “We noticed that 99.9% of our queries are actually only looking at the recent two days of data,” he said. “It’s the rare query over 30 days that looks at the older data. So we wanted to make sure that everything is in cache so that it’s super fast, and it reduces the load on the remote system like GCS or BigTable.” They’ve also set up an alert to make sure that there are enough memcached based on the time series and the number of chunks being generated.
2. Create paging alerts for too many active series, too many writes, and too much memory.
3. Set up SLOs, SLAs, and SLIs for everything. “We have our 6-hour error budget, 1-hour error budget, and 1-day error budget, and our SLOs are public: 99.9% of our queries should be faster than 2.5 seconds and successful, and 99.9% of our writes should be successful and no slower than one second,” he said. And there are SLO-based alerts; if something is wrong in the write path, the on-call person gets alerted and can go to the writes dashboard to start debugging. The Jsonnet for these Cortex dashboards, alerts, recording rules, and yaml can be found here.
Don’t Forget to Use It
Grafana Labs recently had an etcd outage; for two hours they couldn’t accept writes. “The funny thing is we have this nice dashboard that was talking to the gateway, talking to the distributor, talking to the etcd,” Veeramachaneni said. “We recently added etcd but forgot to add this panel in the dashboard, so when writes were failing, we had no clue why they were failing. But that’s why you do postmortems so that you can fix your mistakes. And now we actually have the panel.”
The Read Path
The read path is more challenging, since there are more components and the queries vary in size. “Sometimes somebody sends a query that queries a million time series over 50 days of data, and that’s bound to be slow, so you don’t want to be paged for that,” he said. “On the other hand, if somebody sends a simple query that just looks at one time series over five days of data, and that is taking 10 seconds, you want to be paged for that.”
There’s not a good way to page on the size of the query and latency, so at Grafana Labs, they page for everything. “It turns out we are fast enough, so that we are rarely paged,” he added.
The Reads Dashboard
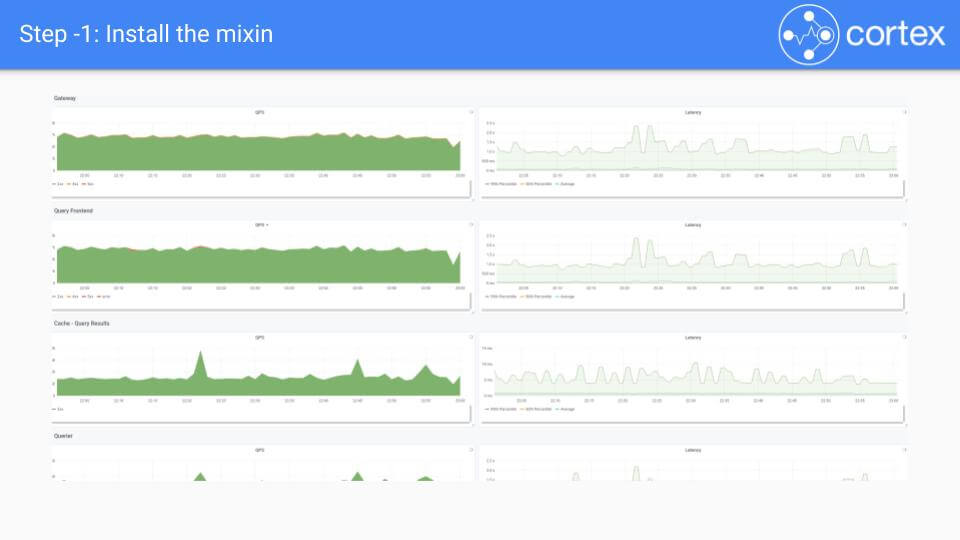
The reads dashboard works the same way as the writes dashboard.
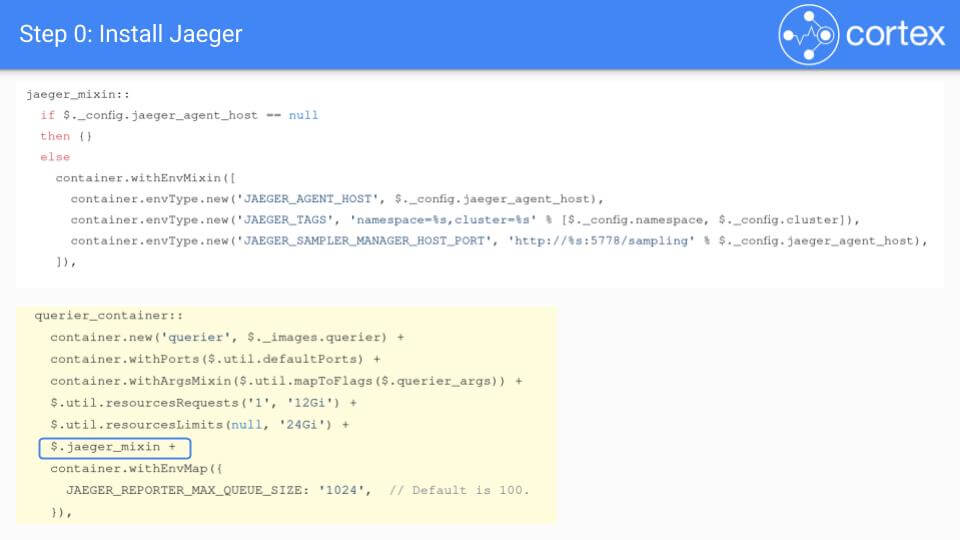
For debugging queries, especially those that are latency-sensitive, the Grafana Labs team uses Jaeger distributed tracing. To configure Jaeger into Cortex, you can use the Jsonnet above or simply add these enrollment variables:
Demo
Veeramachaneni then did a live demo of an outage – a huge query that took a minute and a half. In practice, he wouldn’t have gotten paged for a single query; only when queries are consistently slowed and the error budget is exhausted would a page be sent.
You can watch the demo here:
Limit Everything
Cortex is a multi-tenant system, and Grafana Labs runs one big cluster for U.S. customers and one big cluster for EU customers. “The idea is one customer should not DDoS everyone else,” said Veeramachaneni. “Just make sure that you limit everything.”
Some examples:
1. Keep the default limit for tenants very low, and once it’s hit, get an alert. “You need to make sure that they’re not querying 100 million time series or 5 million time series over 30 days of data,” he said. “You need to make sure that they are not OOMing all the queriers for everyone else.”
2. Set a limit to the number of samples per second that each distributor can handle, the number of series that each ingestor should have per user, and the number of series per metric.

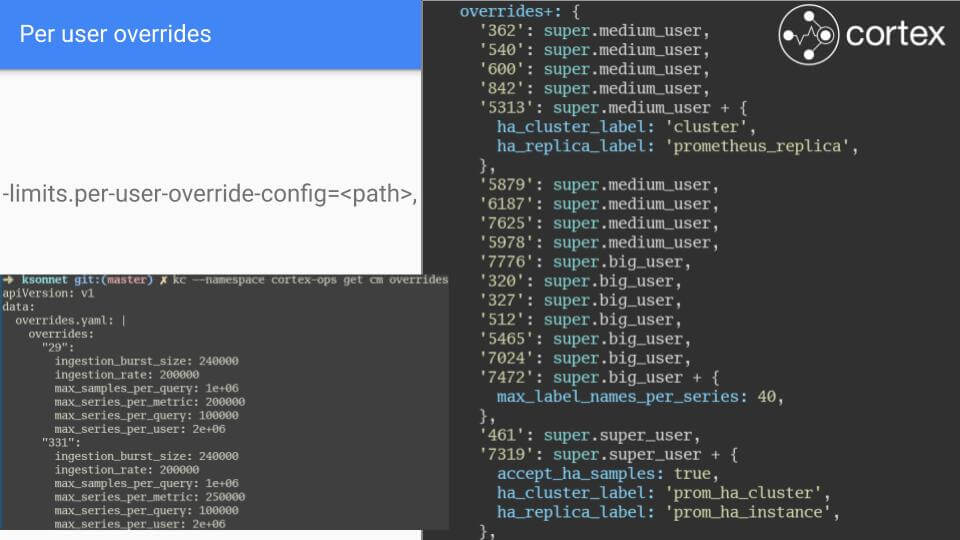
3. When customers hit the default limit, be able to increase the limit as needed. “Cortex is able to override the limits per user, and we use jsonnet on it to template this out because we have hundreds of users and we don’t want to set every one of them by hand,” he said. Grafana Labs uses override variables (small, medium, large, etc.) and a config management solution that’s open source. “There’s a config map that’s updated that Cortex takes up,” he said. “You can see how easy it is for us operators to manage this complexity.”

4. Make sure the limit on the querier and the limit on the query frontend are different. When you have a 30-day request, the query frontend splits it up into 30 one-day requests and runs them in parallel so that the queries are much faster. “In the querier if you set the maximum query length to be 7 days, and in the query frontend if you set it to be 500 days, it makes sense, because the query frontend will let you do a query over a year,” he said. “It’ll split it up into smaller parts and send the smaller part down to the querier. But in the querier if you have a 30 or 90 days, you don’t want to OOM the queriers. So you can look back only seven days.”
5. Have cardinality limit on the queries. “Sometimes people send 5 million time series, and they want to query all of them back together, and that’ll OOM your querier,” he said.
6. Query the ingestors and query the store, and then merge those two things in the queriers. “We have hundreds of QPS, and every single query was going to the ingestor,” he said. “The ingestor was adding a lot of latency to the query layer. So we decided that a lot of these queries don’t need to look at the ingestor, because the ingestor only has recent data and these queries are old based on the dashboards. We have 6-hour chunks, so we set it to 12 hours just in case. So any query that’s older than 12 hours will not hit the ingestor.”
7. Do a lot of index caching. One problem that arose was that if the same queries run in less than 15 minutes, it used to hit the cache for the index. But if the query is run after 15mins, it didn’t hit the cache as index might have changed. The team added another flag that says that any index that is older than 36 ours is a stale index, so it’s cached forever. That made queries a lot faster.
Summary
In short: Build dashboards and alerts, and use the mixin. Scale up with usage. Get Jaeger installed. And limit everything. “At Grafana Labs, we do a weekly on-call,” said Veeramachaneni. “While I’m on call, half my job is to clean up the config, and I keep a look at these warning alerts and make sure that they don’t fire anymore.”
And as he said at the beginning of the talk, taming the beast has gotten easier. “Before we moved to SLO alerts, we used to page for every random thing or whenever somebody opens a big dashboard, you get paged,” he said. “But now only if the 99.9% of the requests are slower than 2.5 seconds do I get paged, and that’s super rare now with all the caching that we do.”


