ICYMI: Find All the Grafana Labs Talks at KubeCon Here
Whether you sat out this KubeCon or were too busy working the hallway track to make it to all the sessions on your list, never fear. You can catch up on all the talks given by Grafanistas here:
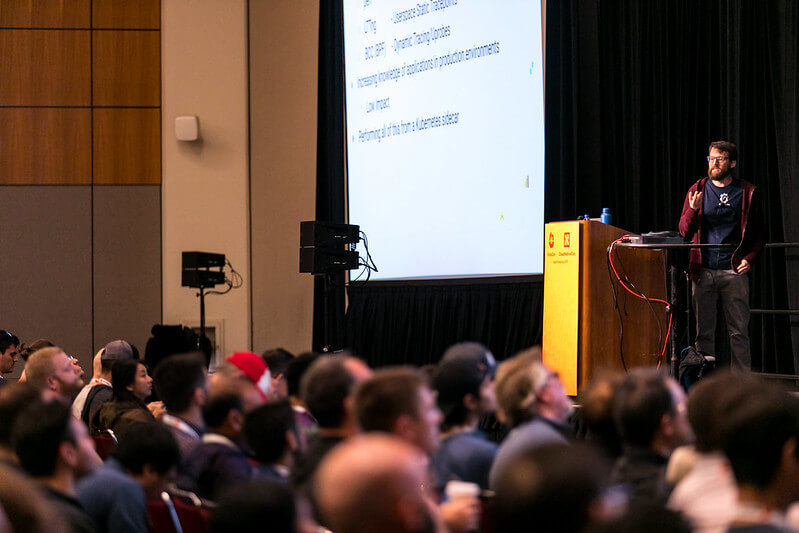
Debugging Live Applications the Kubernetes Way by Joe Elliott

Elliott gave a live demo of a straightforward, Kubernetes-native way to begin debugging applications from a sidecar, which offers low-impact profiling of applications without installing packages or making messy changes to your nodes. Read the recap here.
Blazin’ Fast PromQL by Tom Wilkie
Wilkie covered a series of techniques employed by Cortex for accelerating PromQL queries, and showed how you can use this technology to get these improvements with Thanos and Prometheus too. Read the recap here.
How to Include Latency in SLO-Based Alerting by Björn “Beorn” Rabenstein
The Prometheus maintainer broke down how to apply the principles of The Site Reliability Workbook to latency-based SLOs in Prometheus. Read the recap here.
Every Way We DDoSed Our Cortex by Goutham Veeramachaneni
The Cortex contributor gave tips on Day 2 operations for this distributed version of Prometheus: capacity planning, query performance debugging, and general health monitoring. Read the recap here.
Cloud Native Architecture: Monoliths or Microservices? by Goutham Veeramachaneni and Ed Welch
The pair addressed one common problem with microservices, a complicated configuration and deployment, and presented a solution to this problem that’s being used in Thanos, Loki, and Cortex: a single binary app that can act as a monolith but can also be scaled as microservices. Read the recap here.
Intro: Prometheus by Ganesh Vernekar and Fastly’s Matt Layher
The two gave a primer on Prometheus: its multi- dimensional data model, powerful query language, integrations with many aspects of systems and service monitoring, and advantages over traditional monitoring systems.


