![[KubeCon Recap] How to Include Latency in SLO-Based Alerting](/static/assets/img/blog/SLO_alerting_4.jpg?w=752)
[KubeCon Recap] How to Include Latency in SLO-Based Alerting
“SLO is a favorite word of SREs,” Björn “Beorn” Rabenstein said during his talk at KubeCon + CloudNativeCon in San Diego last week. “Of course, it’s also great for design decisions, to set the right goals, and to set alerting in the right way. It’s everything that is good.”
For the next half hour, the Grafana Labs Principal Software Engineer (and former Google SRE and SoundCloud Production Engineer) set out to explain how and why he and others have approached SLO-based alerting, and how he’s currently incorporating latency into this alerting at Grafana Labs.
Act One: The Basics of SLO
At the start of the talk, Rabenstein laid the foundation for his talk by listing the things he wasn’t going to talk about (but you can look up later for further information):
1. There’s SLO, but there’s also SLI and SLA. “The blue SRE book that Google published three years ago is one of my favorite tech books, and you should read it,” Rabenstein said. “It has a whole chapter, chapter four, which is about SLOs and also touches SLIs and SLAs. It’s all there. So you can get on the same page if you read that.”
2. Enjoy SLOs responsibly. “At SRECon earlier this year in Dublin, Narayan Desai talked about how SLOs can actually go wrong,” Rabenstein said. “This is really nice to hear about what can go wrong. I want to erase the false impression that this is always just working. So you have to always keep thinking.”
3. There’s a science to measuring latency SLOs. Heinrich Hartmann’s talk at SRECon offers a deeper dive into the science behind what Rabenstein talked about. “My talk here is fairly hands-on how you could do it, and I think it’s all mathematically correct,” said Rabenstein. “But in your situation you probably have to do things slightly different, and once you deviate from the recipe, you should actually know the science behind it and watch Heinrich’s talk.”
4. Metrics vs. logs – discuss. “Let’s say you get close to breaching your SLO and you want to get an alert in real time. That’s metrics-based,” said Rabenstein. “If you actually have a breach of an SLA, like you have a customer agreement, and you have not fulfilled your SLA, then your customer gets some reimbursement, and that’s now exact science. You want to give them the exact number of currency units as reimbursement.” In that case, you wouldn’t use your metrics; you would need to go to your logs for an exact calculation. “You could totally do the alerting based on your logs processing, if your log processing is reliable enough and fast enough,” he added. “That would boil down to creating the metrics from the logs on the fly.”
With either metrics or logs, the principles discussed in Rabenstein’s talk should still apply.
Some Background and Resources
Rabenstein first addressed symptom-based alerting, which is covered in chapter six of the SRE book. “Alerting on SLOs is actually a really nice example of symptom-based alerting,” he said. “To understand the whole philosophy behind it and also how to not overdo it, you can read that chapter.”
Chapter 10 in the book, Rabenstein added, covers practical alerting from time series data. “That’s also nicknamed the Borgmon chapter, because it explains how Google is traditionally doing metrics-based alerting and monitoring. Borgmon is the system that was the spiritual grandfather of Prometheus. So that also helps you understand basic concepts, which I’m not talking about here.”
A second important resource is the Site Reliability Workbook, which offers more practical, hands-on instructions. Chapter 5 “goes iteratively through different approaches of alerting on SLOs, and in that way you really understand it,” Rabenstein said. At SoundCloud, he added, he used this chapter to set up alerting on SLOs, and blogged about it and later gave a talk at the Berlin Prometheus Meetup.
Alerting on SLOs
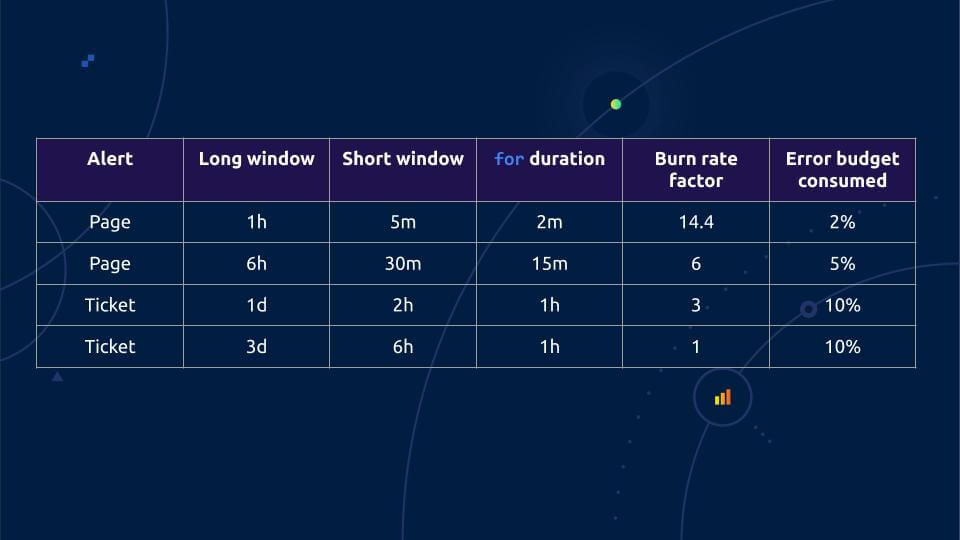
Rabenstein picked up his talk from there, with this table from the blog post:

The basic idea for alerting on SLOs – as described in the SRE book – is to measure the error rate over a variety of time windows (the “long window” in this table) and then alert on them. You page quickly if you are burning your monthly error budget quickly, and you only ticket people if the error budget is burning slowly enough that a response during work hours is acceptable.
“The easiest to understand is the one you have for three days,” he said. “Your average error rate is exactly factor one, the error rate you could sustain while not blowing your error budget. Let’s say you want 99.9% availability. Your error budget is then 0.1% error over a billing period, usually a month. So if you have exactly this 0.1% error rate, factor one, over three days on average, that means you’re exactly burning your error budget as fast as you are allowed to. Which is not too bad, but if anything happens in the rest of the month, you are screwed, right? So this is why if you have burned 10% of your error budget, three days is 10% of a month, you should do something about it. So you get a ticket because you don’t have to wake somebody up. This is a long-term slow error budget burn report. During work hours you can find out what’s wrong in your system.”
The table goes up in speed, with the fastest one the one-hour window. “You have a pretty generous factor of 14.4,” Rabenstein said, “so that means with the 0.1% error budget, if your error rate is 1.44% on average over one hour, you get a page, and the moment you get the page, you have burned 2% of your monthly error budget, within only one hour! That’s way too fast. This is where somebody has to wake up and fix it.”
He then added that intuition would tell you that a one-hour average is too long for a page, because if you have a serious outage, you’d want to know within a minute. “But the intuition is wrong,” he said.

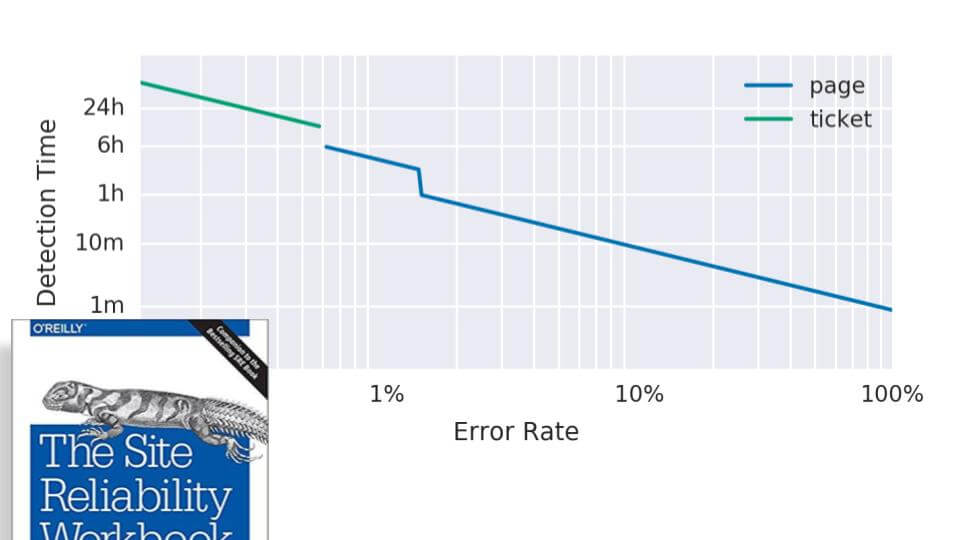
This graph from the workbook shows that “if you have a 1.44% error rate, then it actually takes an hour to detect that,” Rabenstein said. “In a one-hour window, if everything has been fine, 0% error, for most of the time, and then you suddenly begin to have 100% errors, the average is 1.44% within less than a minute. So that’s the interesting thing. Within less than a minute, this alert will page you, even if it’s an average over one hour, so this alert has actually no problem with being too slow.”
The big takeaway: “You can look at pretty long averages and still get meaningful alerts on slow and fast error burn,” he said.
But there’s a potential problem here, as seen in the graph below.

“The blue curve is the actual error rate as it happens,” he explained. “So at T plus 10 minutes you have an outage for whatever – a few instances of your microservice go bad and you have like a 15% error rate. What happens? The red line is this one hour average. So it takes five minutes for this red line to go above the 1.44% error threshold. So after five minutes, even with this partial outage, you get a page. Presumably the engineer on call wakes up, fixes the problem within five minutes, good engineer. Error rate goes down to zero, engineer goes back to bed.”
The problem, though, is that the red line will stay above the threshold for an hour because this error peak is in the one-hour average. The alert fires all that time. You might be tempted to snooze it on Pagerduty or silence the alert in Prometheus. But then if something else happens, and the error spike happens again, the alert has been silenced and no one will be notified.
So how can you make sure that if the outage returns, the alert will reset quickly? “You take the five-minute average, and this is where the short window from the table enters the game,” Rabenstein said. “For the long window of one hour, you take another window of five minutes, and you also calculate the average error rate.”
Alerting on that alone would be too noisy; a few error spikes shouldn’t trigger alerts. “But if you alert on both curves being above the threshold, then you get the best of both worlds,” he said. “This pages here because both green and red are above the fold, and once you have fixed the outage, the green curve will go down really quickly. So from this moment on, your alert ceases to fire. The red area there is when the alert is actually firing, and that’s exactly what you want.”
How to Configure Alerts
The SRE Workbook includes instructions on how to configure alerts in Prometheus (and can be transferred into other systems). But it can be a lot of manual work, and Rabenstein recommended some kind of config management. “At Grafana Labs, we are Jsonnet fans,” he said. “If you write a Jsonnet table here, this is almost precisely the same table, right? So you just type this table into Jsonnet, and then you have a bit of Jsonnet glue code that creates all the recording and alerting rules you need in Prometheus.”

Rabenstein said this SLO config code will eventually be open sourced when the team is finished tinkering with it. At SoundCloud, he added, they hand-coded all the rules, so it’s perfectly doable. Another way to use Jsonnet is the SLO libsonnet that Matthias Loibl created and open sourced. He even added a web frontend for it. “So now you have rule generation as a service,” Rabenstein said.
Act Two: Musings About Latency SLOs
The first half of the talk covered requests that ended in a well-defined error, like a 500. But just as important are latency SLOs.
“Right now you will see in the real world that very few companies give you latency SLAs,” Rabenstein said. “ISPs love to tell you they have 99.9% uptime. What does that mean? This implies it’s time-based, but all night I’m asleep, I am not using my internet connection. And even if there’s a downtime, I won’t notice and my ISP will tell me they were up all the time. Not using the service is like free uptime for the ISP. Then I have a 10-minute, super important video conference, and my internet connection goes down. That’s for me like a full outage. And they say, yeah, 10 minutes per month, that’s three nines, it’s fine.”
A better alternative: a request-based SLA that says, “During each month we’ll serve 99% of requests successfully.” But that doesn’t cover latency, Rabenstein pointed out, and “let’s say I have a request, I want to get a response from my service provider, my browser times out eventually and I tell my service provider, okay, this request didn’t succeed, and my service provider tells me, no, no, no. It would have succeeded. It would just have taken like five minutes and the browser timeout was your fault.”
Internally, this is important, too, as independent teams working on microservices need to have an agreement with each other about how well the microservices work, with an expectation for a specific response time. “You want latency in there, and if it’s not there explicitly, it’s implicit,” he said.
Rabenstein’s next suggestion: “During each month, we’ll serve 99.9% of requests successfully. The 99th percentile latency will be within 500 milliseconds.”
With this SLA, if you get a 503 error in 10 milliseconds, it counts against one error budget but not the other, because it was returned within the 500 ms threshold. And the 1% that are slow could still conceivably fulfill this SLA.
“Slow requests are potentially useless,” he pointed out, “so this would still allow 1.1% of requests to be useless without breaching the SLA. It’s not happening all the time of course, but it’s still kind of weird. Now let’s put ourselves into the shoes of the service provider: I want to alert on burning my error budget, but now I have two error budgets. I have 0.1% errors and I have 1% slow queries. Do I alert if I breach one error budget and not the other? Can I compensate one with the other? It’s all complicated.”
So his conclusion was to try to make slow requests and errors the same. “Tell your customer during each month we will serve 99.9% of requests successfully within 500 milliseconds,” he said. “So that means if an error comes in fast, it’s still an error. If a request comes back, but it’s slow, it counts as an error. That’s fair for the user and easy to reason with for both sides.”
Grafana Labs has applied these ideas to its hosted Prometheus/Cortex offering. Mixed queries can be challenging; Booking.com solved this by creating different buckets of expensive and not-so-expensive queries that had different SLAs for them.
Act Three: A Pragmatic Implementation
“Of course you can iterate from there and make it more complex,” Rabenstein said. “But if you can, just do the simple one.” For SLO-based alerts, you have to apply your measurement somewhere at the edge, to see how fast the system is responding from an external perspective. At SoundCloud, they used an edge load balancer. With Cortex, there’s the Cortex gateway as the entry point to the system.

There’s an ingestion (write) path when people send Prometheus metrics and Cortex needs to ingest them, and there’s a read path where people run PromQL queries to retrieve Prometheus metrics from Cortex. At Grafana Labs, they created a Prometheus histogram on this gateway, with different buckets, including ones at 1 second and 2.5 seconds for their SLOs. They were partitioned by status code, method, and route (read or write path).
Rabenstein acknowledged that conventional wisdom among Prometheus practitioners discourages partitioning histograms because histograms are really expensive in Prometheus. But “more and more I run into use cases where I want to partition the histogram,” he said, “and we have big enough Prometheus servers to do this. Shameless plug, I gave a talk at PromCon very recently where I told people about my research of making histograms cheaper in the hopefully not too far future.”
For Grafana Labs, the SLO was to complete 99.9% of writes successfully in less than one second and respond to 99.5% of reads in less than 2.5 seconds. “This is an SLO, not an SLA,” Rabenstein pointed out. “We are not yet committing to our customers to reimburse them if it’s slower, but we want to in the future. I think it’s a good pathway to set an SLO to inform your designs. And then if you can transform this into an SLA, it will make your users really happy, and it will give you an advantage over your competitors that might have been less ambitious about latency SLOs.” The previously reported efforts to speed up PromQL queries are a good example for improvements inspired by the latency SLO.
How to Do It
To set this up, create recording rules that give an error ratio in which slow requests count the same as explicit errors.
Here are the rules for the read and write SLO errors per request, averaged over one hour:

From the histogram, “we pick the bucket with 1 second for the write rule because this is the latency from our write SLO, our target to do everything fast,” Rabenstein explained. “It’s the push route because that’s the write path. We take from the histogram everything that is not a 500 and fast enough and divide it by the total number. But this is very flexible. You could change it to, for example, exclude 400s because the storm of 404s will be responded to really quickly and that shouldn’t count as free uptime. You can mix and match here.” For the read rule the 2.5 second bucket is used in accordance with the latency from the read SLO.
Corresponding rules exist for all the other required time windows.
Looking back at the table with the original error-based approach, Rabenstein points out that it actually doesn’t change at all. “We use exactly the same principles,” he said. “Once we have defined those recording rules, we are back to square one. Essentially we have now a recording rule that looks like error rate, but it’s actually a rate of errors and slow queries.”
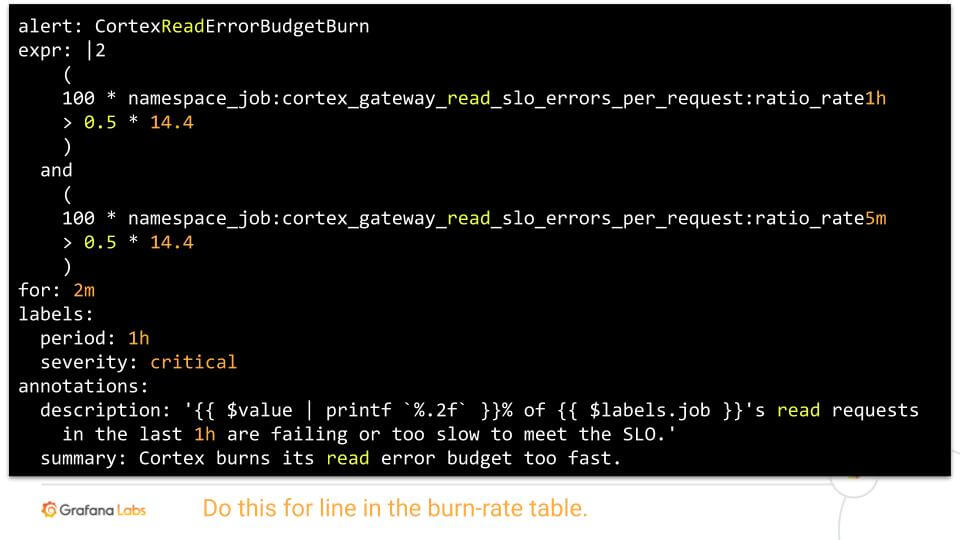
See the following two example alerting rules and compare them to the original purely error based alert above.


Conclusion
“Latency is actually very meaningful in an SLA, and we should do our customers the favor,” Rabenstein said. “SLO-based alerting is really a great idea – with caveats of course.”
Combining those two thoughts results in adding latency to your SLO-based alerting. “SLOs are a bit ambitious, and you can let it inform your design,” he said, “and then at some point you can be really nice to your customers and transform it into a real SLA.” Avoiding needless complexity is very important: “Keep all of that as simple as possible – but not simpler!”


