![[KubeCon Recap] How to Debug Live Applications in Kubernetes](/static/assets/img/blog/debug_live_applications_1.jpg?w=752)
[KubeCon Recap] How to Debug Live Applications in Kubernetes
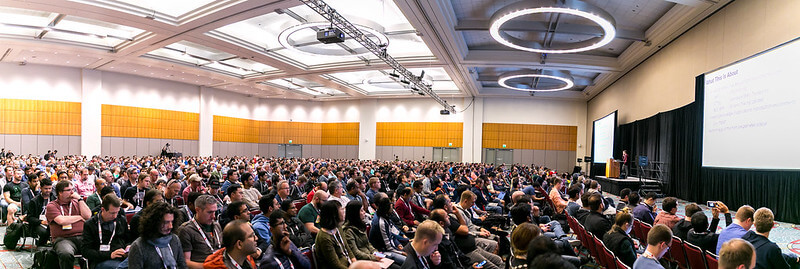
Joe Elliott, a backend engineer at Grafana Labs, took the stage in front of a packed house at KubeCon + CloudNativeCon in San Diego to demonstrate a few of the tricks he uses to debug applications live in Kubernetes.

The goal is to increase your knowledge of applications in the production environment. Elliott’s techniques are framework agnostic and Linux-specific, and they are most useful in situations where you have a known type of problem and application. They’re also very low-impact and can be run at scale, under load. Primarily, he does everything through the Kubernetes API in a Kubernetes-native way.
Linux debugging systems can be confusing, so he recommended this blog post and this one for helpful overviews.
Building a Tool Set
Originally Elliott used a straightforward approach to debugging applications. He would SSH in, run perf, and pull some tools. It helped, but also created a problem: When he was finished, there would be lots of tools installed, or a node with different packages installed, or little notes or files left behind.
He realized a sidecar was the perfect fix – and it came with several benefits.
1. Easy cleanup. You put all of your tools in a container, and when you delete the pod, it all goes away. Because of this, there’s also no risk of impacting the node or other processes on the node.
2. It doesn’t require host access. This technique gives developers an opportunity to see their applications better without having to give them SSH access directly into the node.
3. It’s “easy.” Okay, not easy, easy, but building a tool set container that has your debugging tools in it isn’t hard because it obeys a lot of the same rules that the application containers do. “You can iterate on it, so you can build a container that just has perf and just does some CPU profiling,” Elliott said. “With that working, there’s a new way to see your application. Also, you can write scripts on the fly and, over time, keep building on this tool set container and deploy it anywhere.”
4. It’s immutable. “It can be dropped in on dev, it can be dropped into QA, it can be dropped into prod, it can be dropped into our desktops, and it has this portability aspect to it,” he said.
5. It supports development diversity. Teams using different technologies can build their own containers to debug their own applications.
The Challenges
Elliott said he encountered the most difficulty when he was installing applications – like perf – that want to be installed for a specific kernel.
“If you apt-get perf right now, it will be a version of perf that is built for the kernel that you are running,” he said. “It might have problems when you try to deploy it to a node in your production cluster that has a different version.”
Other issues: Sidecar images can be very large, and they also can’t be edited dynamically.
The Fixes
1. Bake in all of the tooling. You can do this if all of your nodes are going to be the exact same kernel version, he said: “Make it exactly what you need for the kernels you’re running.”
2. Mount from host. This is a slight cheat. By mounting resources from the host, you blur the line between using host access or not.
3. Pull in the tools after deployment. The kernel version is known at this point. “That approach is primarily how I have worked with my .NET Core container,” he said. This has given him the ability to deploy to a lot of environments, such as AWS KOPS with a KOPS cluster on DBN and a GK Ubuntu. (It’s very difficult to keep that working, he added, so baking it in remains the better choice.)
Live application debugging from a sidecar requires the following elements of the pod spec:
shareProcessNamespace
Sharing mounted volumes
Mounting host paths
securityContext.privileged
Of the four listed above, shareProcessNamespace is the most important. “If you set this to true,” Elliott said, “then all processes and all containers can see each other.” That’s a requirement when your debugging tools are going to reach over and start looking at your actual application.
Demos
Elliott presented three different native Linux debugging tools and techniques: perf for CPU profiling; LTTng for userspace static tracepoints; and BCC for uprobes/dynamic tracing.
CPU Profiling
This is a sampling approach. It helps you understand which functions your application is spending time in, and it can also help you figure out why an application is behaving strangely. “Perf is going to sample the stack of our other process a thousand times a second, and it’s just going to write out what happens,” Elliott said.
It records those using a tool called flamegraphs, which created the image below.

Here is a breakdown of the technique:

Elliott explained that since he had to pass a PID, he ran ps x. “If you did not set shareProcessNamespace: true and you ran this ps x command, you would not be able to see your primary process,” he warned, “and you would not be able to perform these techniques.”
He said he mounted temp in this instance “because perf wants to see a perf map in temp” and it’s going to resymbolicate the stack, which makes it easier to understand what’s going on.
Static Tracepoints
“Static tracepoints are frameworks that are designed for very, very high volume – things that you can write in the critical path, and you can record this information and have low-to-no impact on your application,” Elliott explained.
This requires pre-instrumentation, and needs to be built into your application. He primarily uses LTTng (a framework for collecting tracepoints) and Babeltrace. The application and userspace create events and pass it to the LTTng daemon and userspace.

This technique doesn’t require kernel access, and doesn’t require securityContext.privileged to be set to true because it’s simply communicating with the main process in userspace. With Trace Compass, you can pull all these events and see them on your desktop.
“The reason we’re mounting var/run/lttng is because LTTng wants to communicate through a Unix socket, and by default it puts it in var/run/lttng.” Elliott said. “So for this to work at all, both of the applications need access to the same folder, essentially.” He noted that he used .NET Core because it has a pre-instrumentation for LTTng.
Through this technique, events such as garbage collection, thread creation, and deadlocks can be analyzed. Babeltrace supports Python extensions, so it’s possible to write Python scripts and also use to Trace Compass utility to see a histogram.
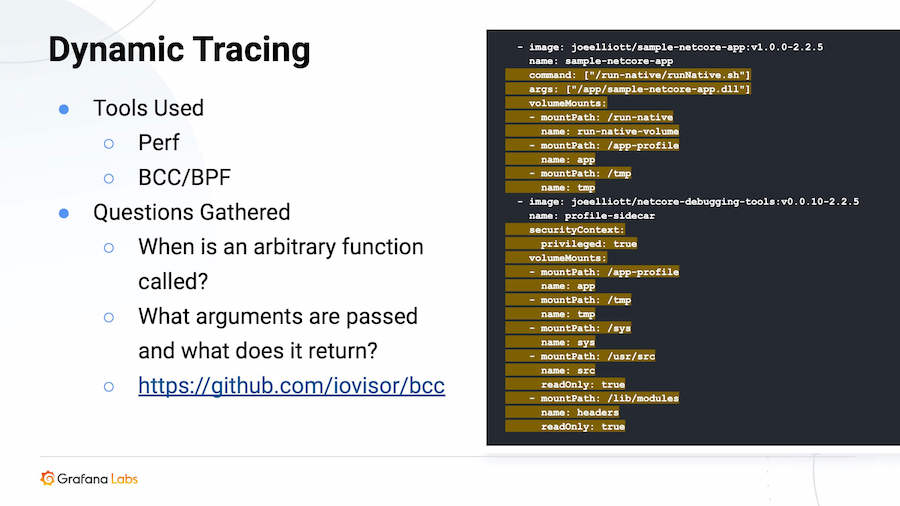
Dynamic Tracing
This is the newest of all the techniques Elliott demonstrated. It requires no instrumentation, but it’s the hardest to pull off.
“Dynamic tracing is a really cool trick, to have the kernel call back to you and tell you at any point when a function is called an application,” he said.

Here, he ran a script called run-native, “and then I’m sharing all this stuff and that’s all related to a specific requirement of Uprobes, which is what BCC is using,” he said. (To ensure it works, you need an on-disk machine code binary.) He also ran a script to take a bytecode compilation, turn it into machine code, and lay it on the disk. “Only that specific trick allows us to do BCC at all to this application,” he added.
As a cheat, he mounted usersource and lib/modules, and that’s to get Linux headers. “It can be difficult to pull the exact Linux headers that your kernel is compiled with into a container running in Kubernetes,” he said. He also mounted /sys from the host because it’s using an Ftrace, which requires /sys.
In one demonstration of this technique, Elliott dumped string parameter values, which he said shows off the power of BPF: “BPF is a technology to write a subset of C that is compiled to a byte code that is run in the kernel. So it makes it very fast and very performant.” He attached it to a Uprobe, took the .NET Core internal string representation, then extracted that string and displayed it on the console.
“Perf also supports dynamic tracing,” he added, “but it only supports null terminated strings, so you can’t actually do this with Perf.”
Using little self-written programs, he said, it’s possible to do things like calculate a histogram or take some data and re-present it in a way that makes more sense outside of the application.
Final Thoughts
It’s possible to inject these tools into an already running pod, he said, but you have to cheat and do it from Docker on the node: “Other than that, Kubernetes pods are immutable.”
For now, that is. It’s expected that Kubernetes 1.16, which is in alpha testing, will be running ephemeral containers.
“If you set the feature gate flag, then you can have access to this,” he said, “and then when it elevates to beta, it’ll be general.”


