KubeCon Demo: A Preview of Grafana & Jaeger
At the Grafana Labs booth at KubeCon + CloudNativeCon in San Diego this week, we showed a demo of a future feature for Grafana: distributed tracing datasources. Until now, Grafana has been bringing together metrics and logs, to be viewed side-by-side on one screen. Now we’re adding tracing, which has been a missing puzzle piece for even more observability in Grafana.
In this demo, we show a dashboard for a simple three-tier demo application: a load balancer, an app tier, and a “database.” In the dashboard we can see periodic errors on the app tier. We switch to the Grafana Explore area where we can pivot to viewing the logs for the application. From the logs we can now see that Grafana can parse out fields from the log lines and link specific fields to other applications – in this case linking the trace ID to Jaeger.
The seamless switching between metrics, logs, and traces is made possible by the telemetry’s metadata: In the example above, the app’s metrics come from a Prometheus datasource that uses a set of relabeling rules that it shares with the Loki datasource, our log aggregation system. It’s this sharing of configuration that systematically guarantees a metrics/logs correlation.
The switch from logs to traces is enabled by our applications’ consistent logging of trace IDs. Those IDs can be parsed by Explore’s log viewer and turned into links to view more details. In the demo above, it’s an internal link to the experimental Jaeger datasource, and it only works in that branch. External links from matched patterns in Loki have been possible since Grafana v6.5 beta. In the Loki datasource configuration, there is a new section about derived fields, where the patterns for external links can be created.
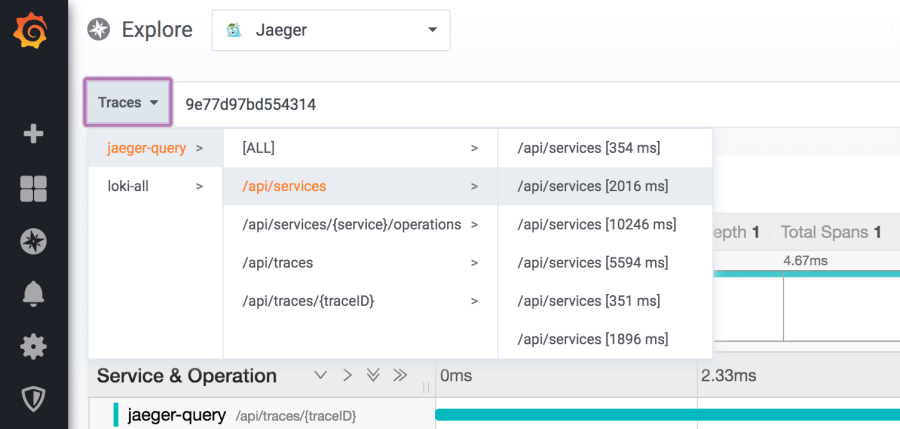
The experimental Jaeger datasource also comes with a trace selector that shows a list of services that break down into their operations, and then show the ten most recent traces. We added this so you can quickly browse traces when not coming directly into Explore with a trace ID.

The changes to Grafana making this possible are very much a work in progress; you can follow along with the PR.
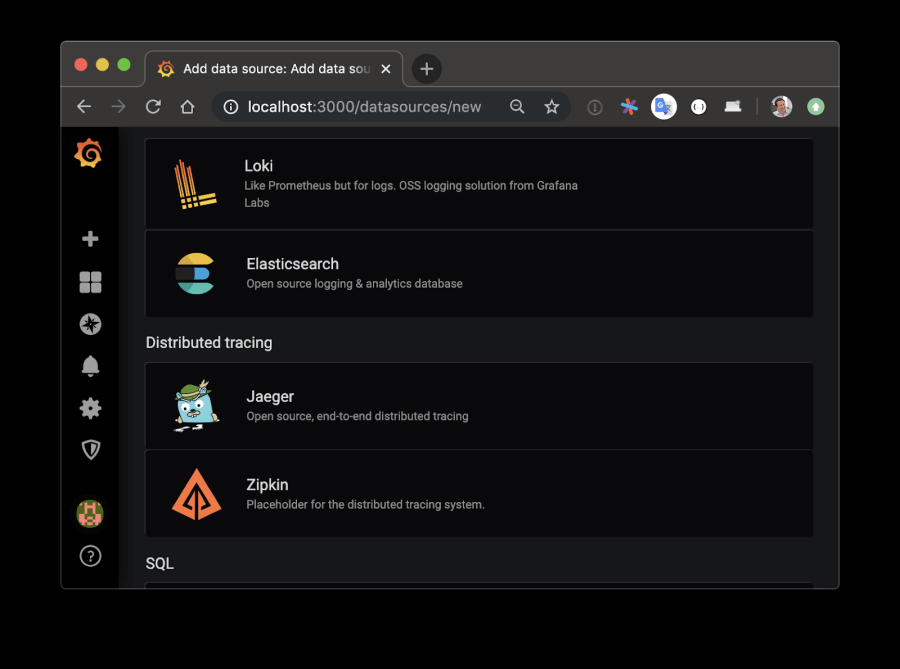
This demo is a statement of intent: Right now we’re embedding the Jaeger UI in an iframe, but in the future we’re going to make it possible to natively visualize traces in Grafana. We want to apply the same Grafana “big tent” ethos here, too – even though the demo is only for Jaeger right now, we want to support other distributed tracing systems in the future.

The experimental branch that contains the Jaeger datasource also contains a Docker compose file that lets you run most of the pieces together: Grafana (experimental image from the branch), Loki, and Jaeger. Note how the compose file uses Loki itself for the Docker logging driver (see setup instructions).
For the demo application used in the video, take a look at this GitHub repo. Try it out and let us know what you think.


