New in Grafana 6.4: The Logs Panel
At Grafana Labs, we are working to make it easier to visualize data that comes from many different sources and in many different ways. We know that our customers are usually using more than one system to track what’s going on within an infrastructure. If you are a system administrator, or even a curious developer, there is a very high probability that you are monitoring and quite regularly reviewing your logs to find valuable and important information in them. Displaying logs together with other visualized data can offer more clarity around what is happening in your application.
That’s why in Grafana 6.4 we have a new addition to our dashboard panels: the logs panel. Logs panels can be very useful when you want to see the correlations between various visualized data and logs in a specific time. You can also quickly filter your logs for a specific term, label, or time period.
How to Set Up a Logs Panel
You can set up a logs panel in any dashboard. However, we believe that logs are most useful when you see them with other related data. You have probably already set up dashboard panels that help you with monitoring your infrastructure. We suggest you create and set up logs panels in the same dashboard that contains the visualized data related to it. Here’s how to do it:
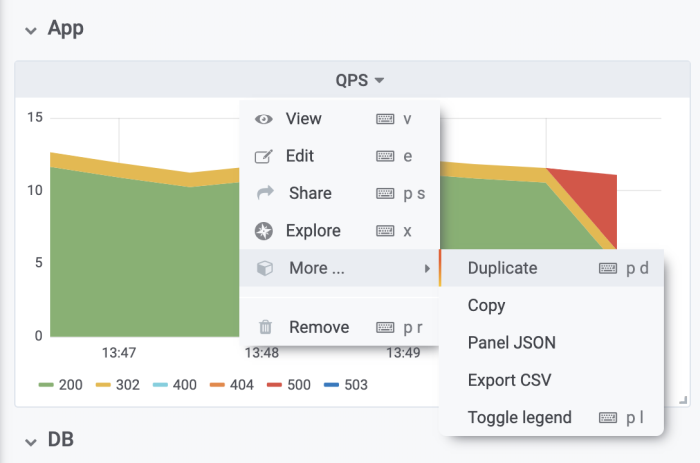
1. Duplicate the panel for which you want corresponding logs. In this example, we are using a Queries per Second panel of our application. As you can see in the panel, we have suddenly started to experience internal server errors, and we would like to see logs to learn more about what is happening in our app.

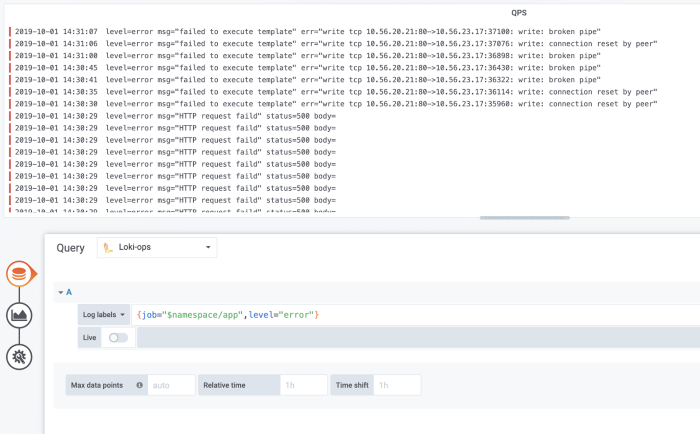
2. Open the duplicated panel in edit mode, so you can transform it into a logs panel. In panel edit mode, you are now able to review the datasource and metrics that are being visualized in the original QPS panel. As our goal is to display logs that are related to the QPS panel and find out more information about the internal server errors, we need to copy the relevant part of the query that is going to be used to retrieve logs from the used logging database (e.g. Loki). In our specific case it is the {job="$namespace/app"}.

3. Change the datasource to your logging database, and paste the query that you have copied. Don’t forget to copy query first. After you change the data source, you won’t be able to access the query anymore (we are planning to make this process smoother in the future). Also make sure that you have adjusted copied query to the query language of your logging database.

4. Set up the visualization. Choose the Logs panel from the list to display logs.

5. Adjust panels. Return to the dashboard and adjust panels to your liking. As you can see, with displayed logs, it is easier for us to detect what is happening in our app, and why are we experiencing sudden internal server errors.

6. Filter your logs. If you are receiving a large number of logs, you can filter out the ones that you are not interested in. Logs can be filtered based on different search criteria such as level, status, body, and others.

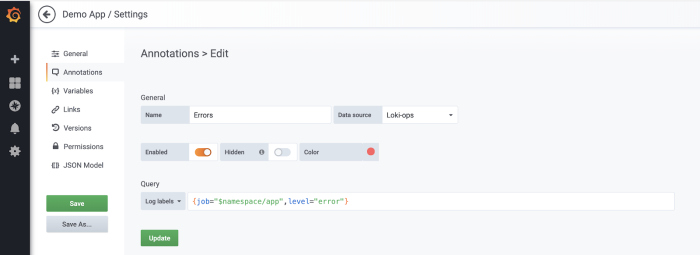
7. Add annotations. If that is not enough, you can always add annotations based on your logging database. Go to dashboard settings and add new Annotation. Choose your logging database as a datasource, and add the relevant query. In our case, it is going to be error logs.

8. You are now able to see annotations with the actual error message.

Resources
Monitoring logs is crucial. Every system administrator should do it because it gives you visual feedback about your logs, and that allows you to give them some meaning. By using the logs panel, you can also quickly filter for a certain term, label, or time period.
For more information about the logs panel, check out the documentation and the demo in this video made by a member of the Grafana Labs team.


