How to Fix a Broken Grafana Dashboard with the API
Recently, we ran into a problem where a customer’s dashboard broke to such an extent that it hung on loading. This is a really rare problem and in this case was an instance where the customer had created a variable that referenced itself. Once the dashboard is broken in this way, it is impossible to reach a screen allowing you to remove that variable. This post is not about how it was broken, but about how we resolved the error.
So, how does one recover all the hours of work put into making a dashboard look just right? We’ll walk through a couple of different ways of getting out of this sticky situation.
The Problem
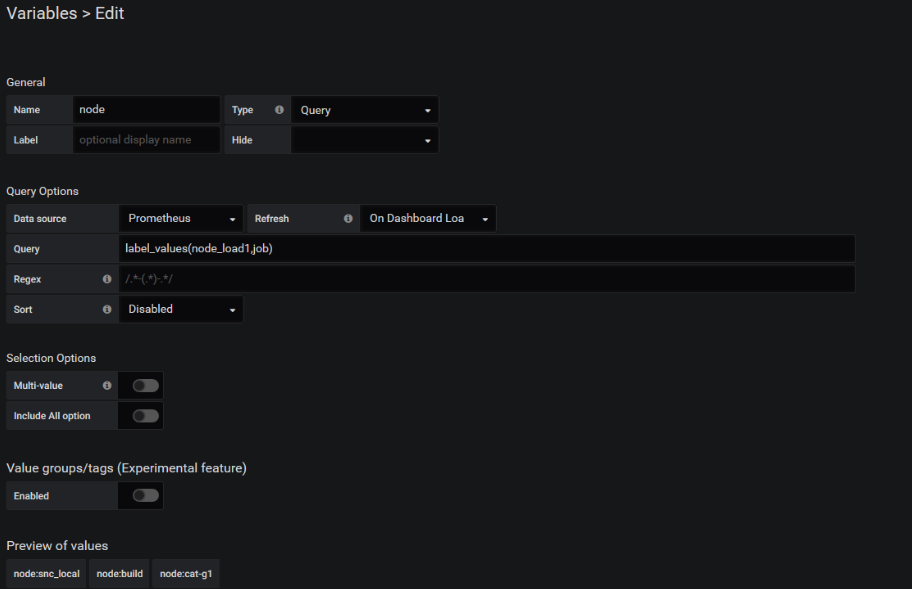
First, let’s create a simple dashboard with a working variable in it.


I also created a few edits to the dashboard, so we can see how versioning works. More on that later.
Now let’s break the dashboard by adding a self-referencing variable.

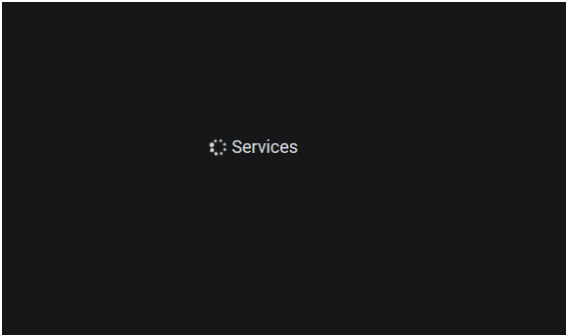
Now, when we load the dashboard, we just see this screen with a spinning “Services” error message.

Solution #1: Using the API
To fix this, we first need to use the API. All the commands here will be run from a regular Linux terminal session, running BASH and using the CURL and JQ commands. The first thing we need to do is create an API key to interact with the API. In Grafana navigate to Configuration -> API Key.

Click “Add API Key” and create one with Admin level privileges. Run the curl command it shows to confirm everything is working. If you pipe that through jquery (jq) you should see the JSON describing the dashboard in detail.
~> curl -H "Authorization: Bearer eyabcdevfgabcdefghabcdevfgabcdefghabcdevfgabcdefghabcdevfgabcdefghabcdevfgabcdefghabcdevfgabcdefgh0==" http://cat-g1.local:3000/api/dashboards/home  |jq
{
  "meta": {
	"isHome": true,
	"canSave": false,
	"canEdit": true,
	"canAdmin": false,
	"canStar": false,
	"slug": "",
	"url": "",
	"expires": "0001-01-01T00:00:00Z",
	"created": "0001-01-01T00:00:00Z",
[snip]
	"timezone": "browser",
	"title": "Home",
	"version": 0
  }
}
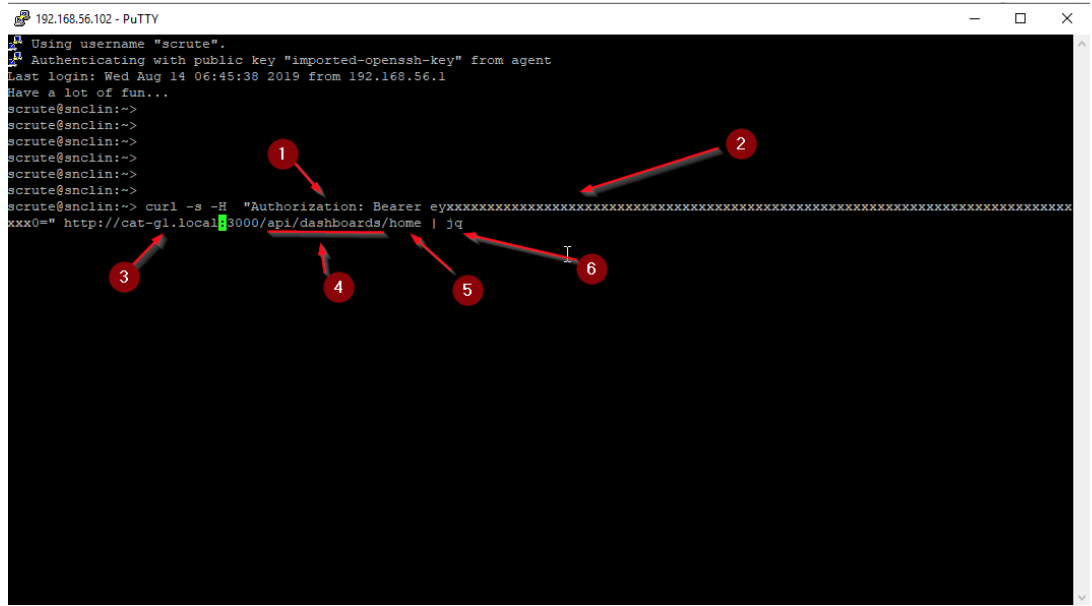
Let’s dissect that curl command line.

- The preamble you need in the authorization header
- The API key you just generated (obviously this has been obfuscated)
- The URL of my test grafana server
- The API call URl. These are all documented
- The parameter sent to the API call
- Pipes the output through jquery, so we can coloured formatting etc.
If you’re doing a lot of API calls from the command line, it may be useful to create a small shell script to run CURL instead.
The output of this command is actually the JSON describing your home dashboard, so we’ve nearly got access to what we want already.
The actual API call we want is to /api/dashboards/uid/[hash] where [hash] is the unique ID of the dashboard you’re trying to load that you see in the URL. So, using Jquery to dissect the JSON, we can easily see where the problem is.
~> curl -s -H "Authorization: Bearer ey...X0=" http://cat-g1.local:3000/api/dashboards/uid/zwXQsOdZz  |jq .dashboard.templating
{
  "list": [
	{
  	"allValue": null,
  	"current": {
    	"tags": [],
    	"text": "All",
    	"value": [
      	"$__all"
    	]
  	},
  	"datasource": "Prometheus",
  	"definition": "label_values(node_load1,job)",
  	"hide": 0,
  	"includeAll": false,
  	"label": null,
  	"multi": false,
  	"name": "node",
  	"options": [],
  	"query": "label_values(node_load1,job)",
  	"refresh": 1,
  	"regex": "",
  	"skipUrlSync": false,
  	"sort": 0,
  	"tagValuesQuery": "",
  	"tags": [],
  	"tagsQuery": "",
  	"type": "query",
  	"useTags": false
	},
	{
  	"allValue": null,
  	"current": {
    	"isNone": true,
    	"text": "None",
    	"value": ""
  	},
  	"datasource": "-- Grafana --",
  	"definition": "SELECT ${broken:csv}",
  	"hide": 0,
  	"includeAll": false,
  	"label": null,
  	"multi": false,
  	"name": "broken",
  	"options": [],
  	"query": "SELECT ${broken:csv}",
  	"refresh": 1,
  	"regex": "",
  	"skipUrlSync": false,
  	"sort": 0,
  	"tagValuesQuery": "",
  	"tags": [],
  	"tagsQuery": "",
  	"type": "query",
  	"useTags": false
	}
  ]
}
With this, we can dump the entire dashboard section to a file, edit the file to remove the broken variable, and then import it as a new dashboard.
~> curl -s -H "Authorization: Bearer ey...X0=" http://cat-g1.local:3000/api/dashboards/uid/zwXQsOdZz |jq .dashboard > broken.jsonEdit the broken.json and remove the following sections:
- The template section that is broken
- The UUID, name, and version.
Make sure you keep it as valid JSON (no trailing commas, for example).
In Grafana, navigate to Dashboards-> Manage-> Import Paste the contents of your broken file in the text box there, and click “Load.” If your JSON is valid, you should have your old dashboard back, minus the broken variable.
Solution #2: Using Versioning
It is also possible to repair this problem by using the inbuilt dashboard versioning.
Get the ID of your broken dashboard.
~> curl -s -H "Authorization: Bearer ey...X0=" http://cat-g1.local:3000/api/dashboards/uid/zwXQsOdZz  |jq .dashboard.id
4
Get the version list of the broken dashboard.
~> curl -s -H "Authorization: ey...X0=" http://cat-g1.local:3000/api/dashboards/id/4/versions|jq
[
    {
	"id": 56,
	"dashboardId": 4,
	"parentVersion": 7,
	"restoredFrom": 0,
	"version": 8,
	"created": "2019-08-14T14:05:45+01:00",
	"createdBy": "admin",
	"message": "broken"
  },
[snip]  {
	"id": 49,
	"dashboardId": 4,
	"parentVersion": 0,
	"restoredFrom": 0,
	"version": 1,
	"created": "2019-08-14T12:52:22+01:00",
	"createdBy": "admin",
	"message": "Initial save"
  }
]
Here you can see all the history of the dashboard versions. If you want to examine the JSON for a specific version, go ahead. The dashboard version ID is actually called “parentVersion”
~> curl -s -H "Authorization: Bearer ey...X0=" http://cat-g1.local:3000/api/dashboards/id/4/versions/8 |jq
  "id": 56,
  "dashboardId": 4,
  "parentVersion": 7,
  "restoredFrom": 0,
  "version": 8,
  "created": "2019-08-14T14:05:45+01:00",
[snip]
   "uid": "zwXQsOdZz",
	"version": 8
  },
  "createdBy": "admin"
}
We can look at the difference between two dashboards, but the output is designed for input to the frontend, so that’s not very helpful.
We can, however, tell the backend to restore the previous version before we broke it.
~> curl -s -H "Content-Type: application/json" -H  "Authorization: Bearer ey...X0=" http://cat-g1.local:3000/api/dashboards/id/4/restore -d '{"version":7}'
{"id":4,"slug":"cpu_test_query","status":"success","uid":"zwXQsOdZz","url":"/d/zwXQsOdZz/cpu_test_query","version":10}
Conclusion
Using the API isn’t just for the developer types wanting to automate everything. In addition to being useful if you need to dig yourself out of a hole, gaining some familiarity in interacting with the API can help you discover new ways of managing and interacting with your Grafana system, from copying dashboards from one system to another to producing metadata about your Grafana usage.


