Ask Us Anything: Your Questions about MySQL, Elasticsearch, Grafana, and More
The Grafana Labs community has more than 600 developers around the world who contribute to our open source projects. From time to time, they also ask really great questions about how to get started in Grafana, how to solve an issue, or how to implement best practices for various functions.
Here are three questions that have gotten some of the most clicks on the Grafana community board – and the answers from Grafana Labs’ Director of Software Engineering, Daniel Lee.
Question #1
Hi, I’m new to Grafana and playing around to see if it could fit my needs for a research lab. I’m using grafana-server Version 4.5.2 (commit: ec2b0fe) I have successfully added a MySQL data source.
mysql > DESC meteo;
| Field | Type | Null | Key | Default | Extra |
|---|---|---|---|---|---|
| id | int (100) | NO | PRI | NULL | auto_increment |
| date_insert | datetime | NO | NULL | ||
| temperature | float | NO | NULL |
Following the documentation, I’ve added a panel “Table” with the following query…
SELECT
  date_insert as 'Date',
  temperature as 'Temperature'
FROM meteo
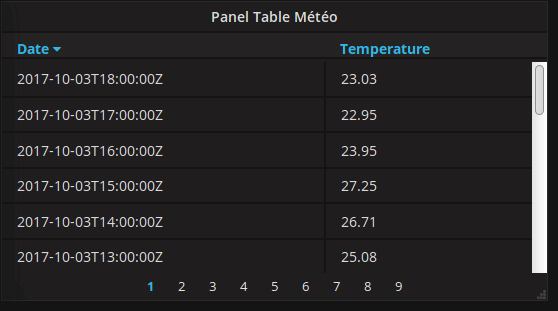
…and chosen “Format as Table." The result is ok as you can see:

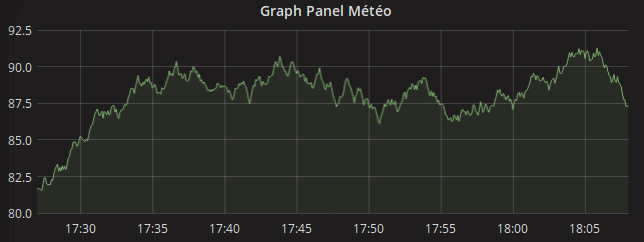
Now I would like to have a graph like this:

How can I achieve this with my database? –@zigobs
Answer
There are lots of examples on the docs page for MySQL.
This will show raw time series data (time series is a list of datetime+value pairs):
SELECT
   UNIX_TIMESTAMP(date_insert) as time_sec,
   temperature as value,
   'temperature' as metric
FROM meteo
WHERE $__timeFilter(date_insert)
ORDER BY date_insert ASC
If you want to group by time (by hour or day, for example), here is one way. (There is another example in the docs that uses DIV.)
SELECT
  MIN(UNIX_TIMESTAMPE(date_insert)) as time_sec,
  avg(temperature) as value
FROM meteo
GROUP BY date_format(date_insert, $interval)
ORDER BY date_format(date_insert, $interval) ASC
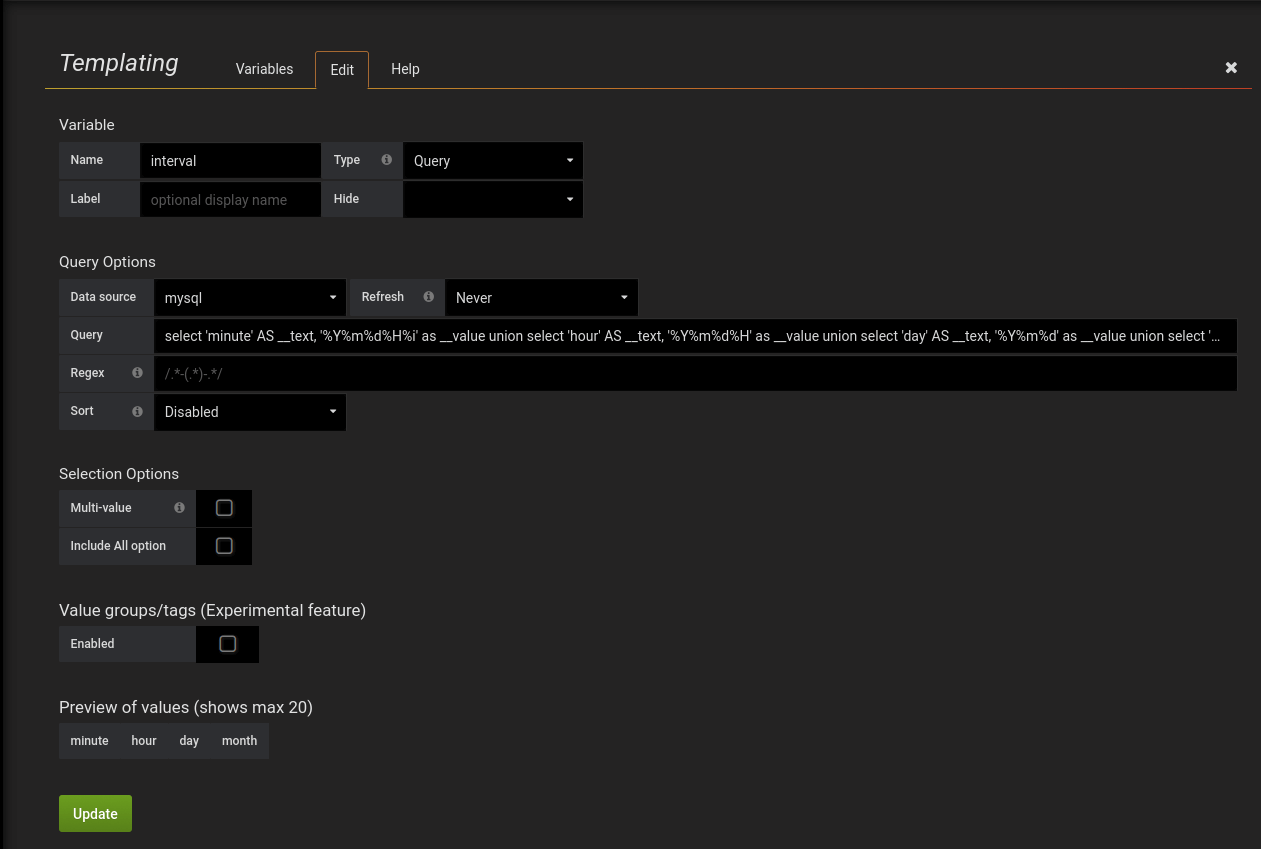
$interval is a template variable that allows you to switch from grouping by minute, hour, etc. and looks like this:

This is the query in the above screenshot:
select 'minute'  AS __text,  '%Y%m%d%H%i'  as __value
 union select  'hour'  AS  __text,  '%Ym%d%H'  as  __value
 union select  'day'  AS  __text,  '%Y%m%d'  as  __value
 union select  'month'  AS __text,  '%Y%m'  as  __value
Note: There have been several stable releases since this response was given. In Grafana v5.4 released last year, we added a MySQL query builder, which means that you can build queries without writing SQL statements most of the time. Learn more here.
Question #2
Is it possible to set alternative names for metrics in graph panels? By default, metric name is returned from datasource response. For example, I want name “My alternative metric #1” instead of “metric_1”, “My alternative metric #2” instead of “metric_2”. –@jiltsovs
Answer
It is done differently for different data sources:
- Graphite: alias or aliasByNode function
- Prometheus: “Legend format” field on the metric tab
- InfluxDB: “Alias By” field on the metric tab
Those functions are database specific. So if you want this feature in your data source, then you will have to implement it. Here is how I did it for the Azure Monitor data source.
Question #3
I have some job data I’m storing in Elasticsearch, let’s say:
{
  name : (optional)
  status : [running/waiting]
  @timestamp : ...
}
I can plot a count of all running jobs with the query “status:running”; I can plot a count of all running jobs which have a name using “status:running and name:*”. How do I plot a count of all running jobs with no given name? –@spacemoose
Answer
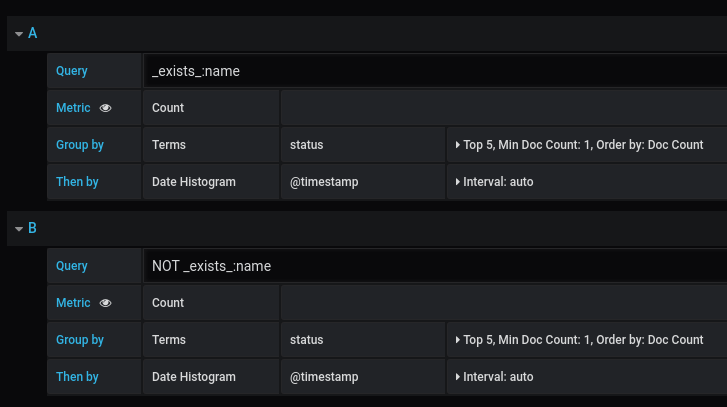
We suggest reading up on the Elasticsearch query string syntax. The author finds out that you can filter by any non-null values using a special field name called _exists_. Using the NOT boolean operator together with _exists_ you can filter by null values. For reference, the first query below filters all documents where name field have a value and the second query filters all documents where name field doesn’t have a value.

One of the core tenets of Grafana Labs is the concept of built better together. Now you can join the conversation or ask a question on the Grafana community board.


