Worth a Look: More Public Grafana Dashboards
A couple months ago, we wrote about some Grafana dashboards that large organizations, for a variety of reasons, have made public with their actual live data. And we followed that up with a look inside the public dashboards at GitLab, a self-described “ridiculously transparent” company.
It’s always interesting to see how Grafana users are setting up their visualizations, so we decided to do another roundup. Check these dashboards out, and get inspired.
Fermilab
A U.S. Department of Energy national laboratory in Illinois, Fermilab specializes in high-energy particle physics. One of its projects is the HEPCloud, a platform for facilitating the provisioning to particle physics experiments of computing resources from commercial and community clouds, grid federations and high performance computers. The lab displays HEPCloud resource distribution in Grafana dashboards on its website.

Open Science Grid
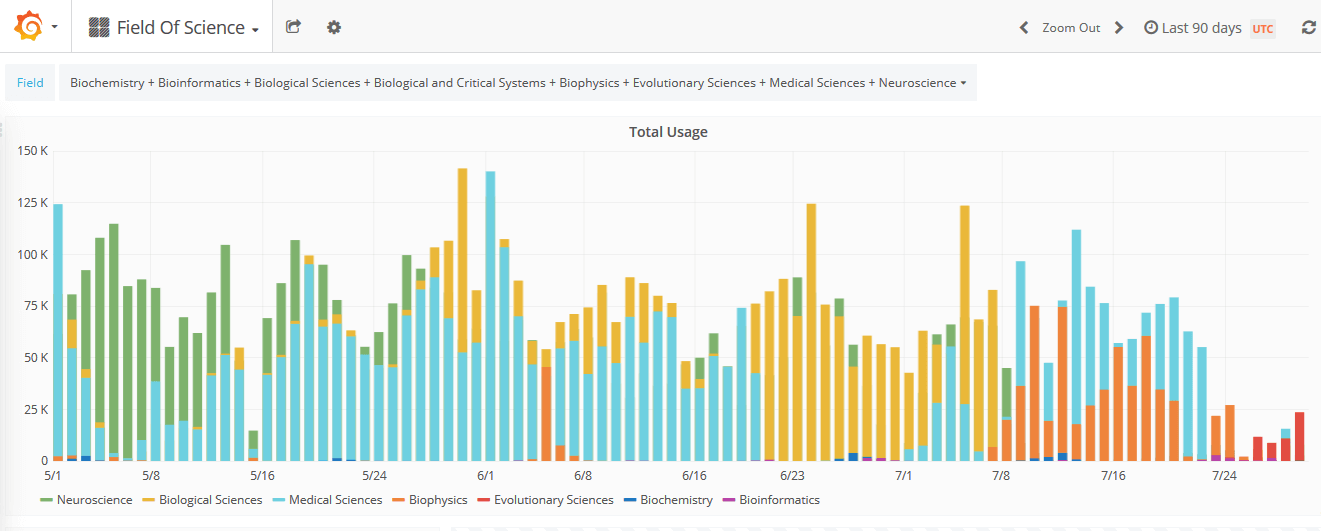
A distributed computing partnership for data-intensive research in the U.S., Open Science Grid helps research projects get access to high throughput computing and storage resources at 100+ sites across the country (including Fermilab). More than a billion CPU hours are delivered on the OSG in the course of a year, and the organization makes a large number of its Grafana dashboards public, including this one showing the different fields of science that are being served.

Smart Energy Informatics Lab
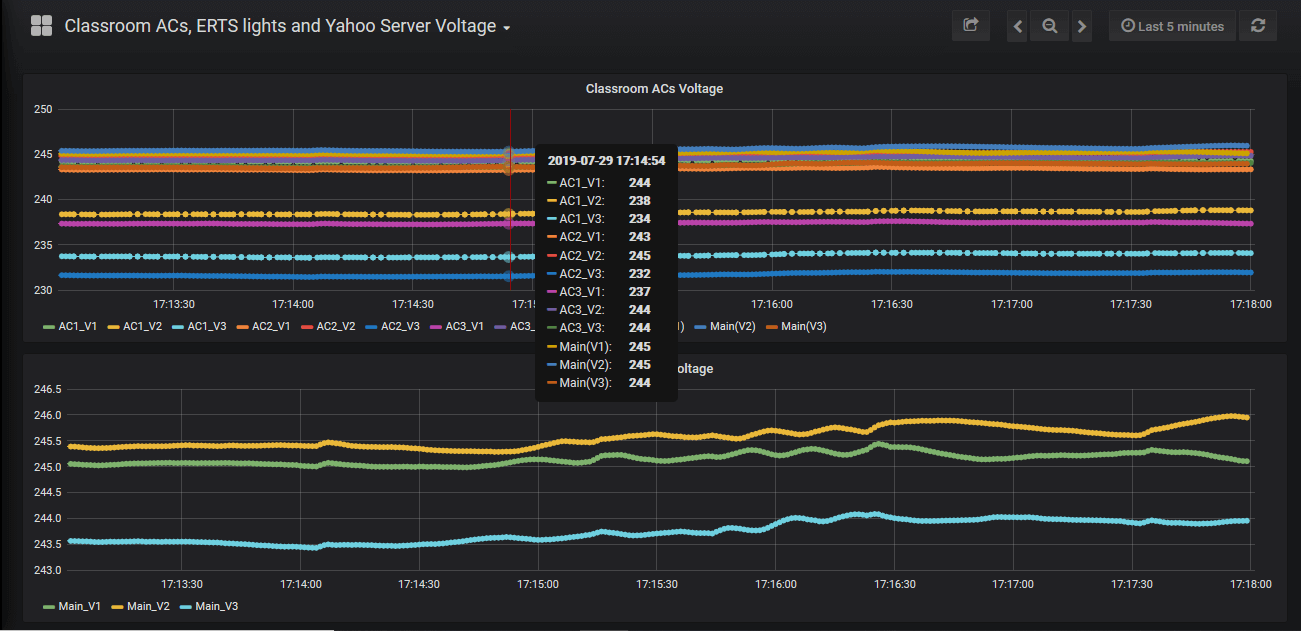
A lab in Mumbai, India, Smart Energy Informatics Lab focuses its research on IoT-based solutions for saving energy in buildings. The organization shares public Grafana dashboards that show real-time visualization of power consumption in a smart classroom complex it set up in the Kanwal Rekhi School of Information Technology (KReSIT) in Mumbai.

catalystBIT
Based in Stockholm, Sweden, catalystBIT provides business intelligence technology for commercial real estate, collecting and aggregating all kinds of data – from space temperature to security cameras – from IoT sensors in “smart” buildings and visualizing the building analytics data in Grafana dashboards. Check out the company’s demo and this video showing the dashboards.
See Your Dashboard Here!
Got a great dashboard you’re particularly proud of? Share it with us on Twitter, and we could include it in our next roundup!


