Guest Blog Post: How the k6 Load Testing Tool Is Leveraging Grafana
Like Grafana Labs, my company, Load Impact, is built on open source. When we set out to build the k6 load testing tool, we knew we wanted to offer a purely open source stack.
We’ve done performance testing for the better part of the past 15 years. When we looked at the market a couple of years ago, we saw a lot of both commercial and open source tools, and they were mostly either too simple or too complex. Additionally, there was nothing designed specifically for developers. So we saw this big opportunity to build a tool that was targeting the unique workflows and processes that developers are used to. And it would be suitable for both doing simple tests and scaling as needed.
A Tool for Developers
We introduced the open source k6 tool in February 2017, with the following developer-friendly features:
The tests are code. The test cases that you write are all in Javascript, which is a language very familiar to a lot of developers. A lot of the other tools that exist either use an esoteric scripting language or are graphical user interface (GUI)-based, which means your expressiveness is reduced and the output, in the case of GUI-based tools, cannot be reliably version-controlled.
It’s a command line application. We use a modern command line interface that will feel familiar to other DevOps tooling.
The tool is automation-native. We built in features that make it very easy to drop into a continuous integration, continuous delivery pipeline, which is also something that’s essential when you’re trying to automate your tests.
Using Grafana for Visualization
We chose to have an open source stack because many developers like and expect this option. Plus, we knew we didn’t want to build the entire thing ourselves, because while we know testing very well, we’re not necessarily experts in the other parts. So we decided to leverage InfluxDB, which is ideal for the time series metrics that our tool spits out.
Grafana was something we had used ourselves, and we knew it was the de facto standard among developers for visualizing time series data. It also works very well with influxDB, so it was a natural fit.
What I find nice about Grafana is that you can create very flexible dashboards and visualizations, but it’s still very easy to use. That’s something that we are also striving for with k6.
Once we launched the tool, we started hearing from users that they love Grafana for looking at the results from the tests that they’re running, but also for making that data available to other parts of their organizations through the user-friendly dashboards.
Community members have built and published these fantastic k6 dashboards:
- k6 Load Testing Results by Dave Cadwallader
- k6 Load Testing Results by Stian Øvrevåge
- k6 Load Testing Results by cyaiox
How k6 Works
Using k6 with InfluxDB and Grafana is straightforward. I’ll assume you have InfluxDB and Grafana running below, but if not, check out the Docker Compose file we have in the k6 GitHub repo to quickly get a test environment up and running.
- Install k6
We have native installation instructions for Linux, Mac, and Windows. We also have a Docker image that can be downloaded via docker pull loadimpact/k6. I’ll assume k6 is installed on your system moving forward.
- Write a test
Once you have k6 installed, you need to write a test case in Javascript. I’ll use the following example exercising our test API:
- Run test
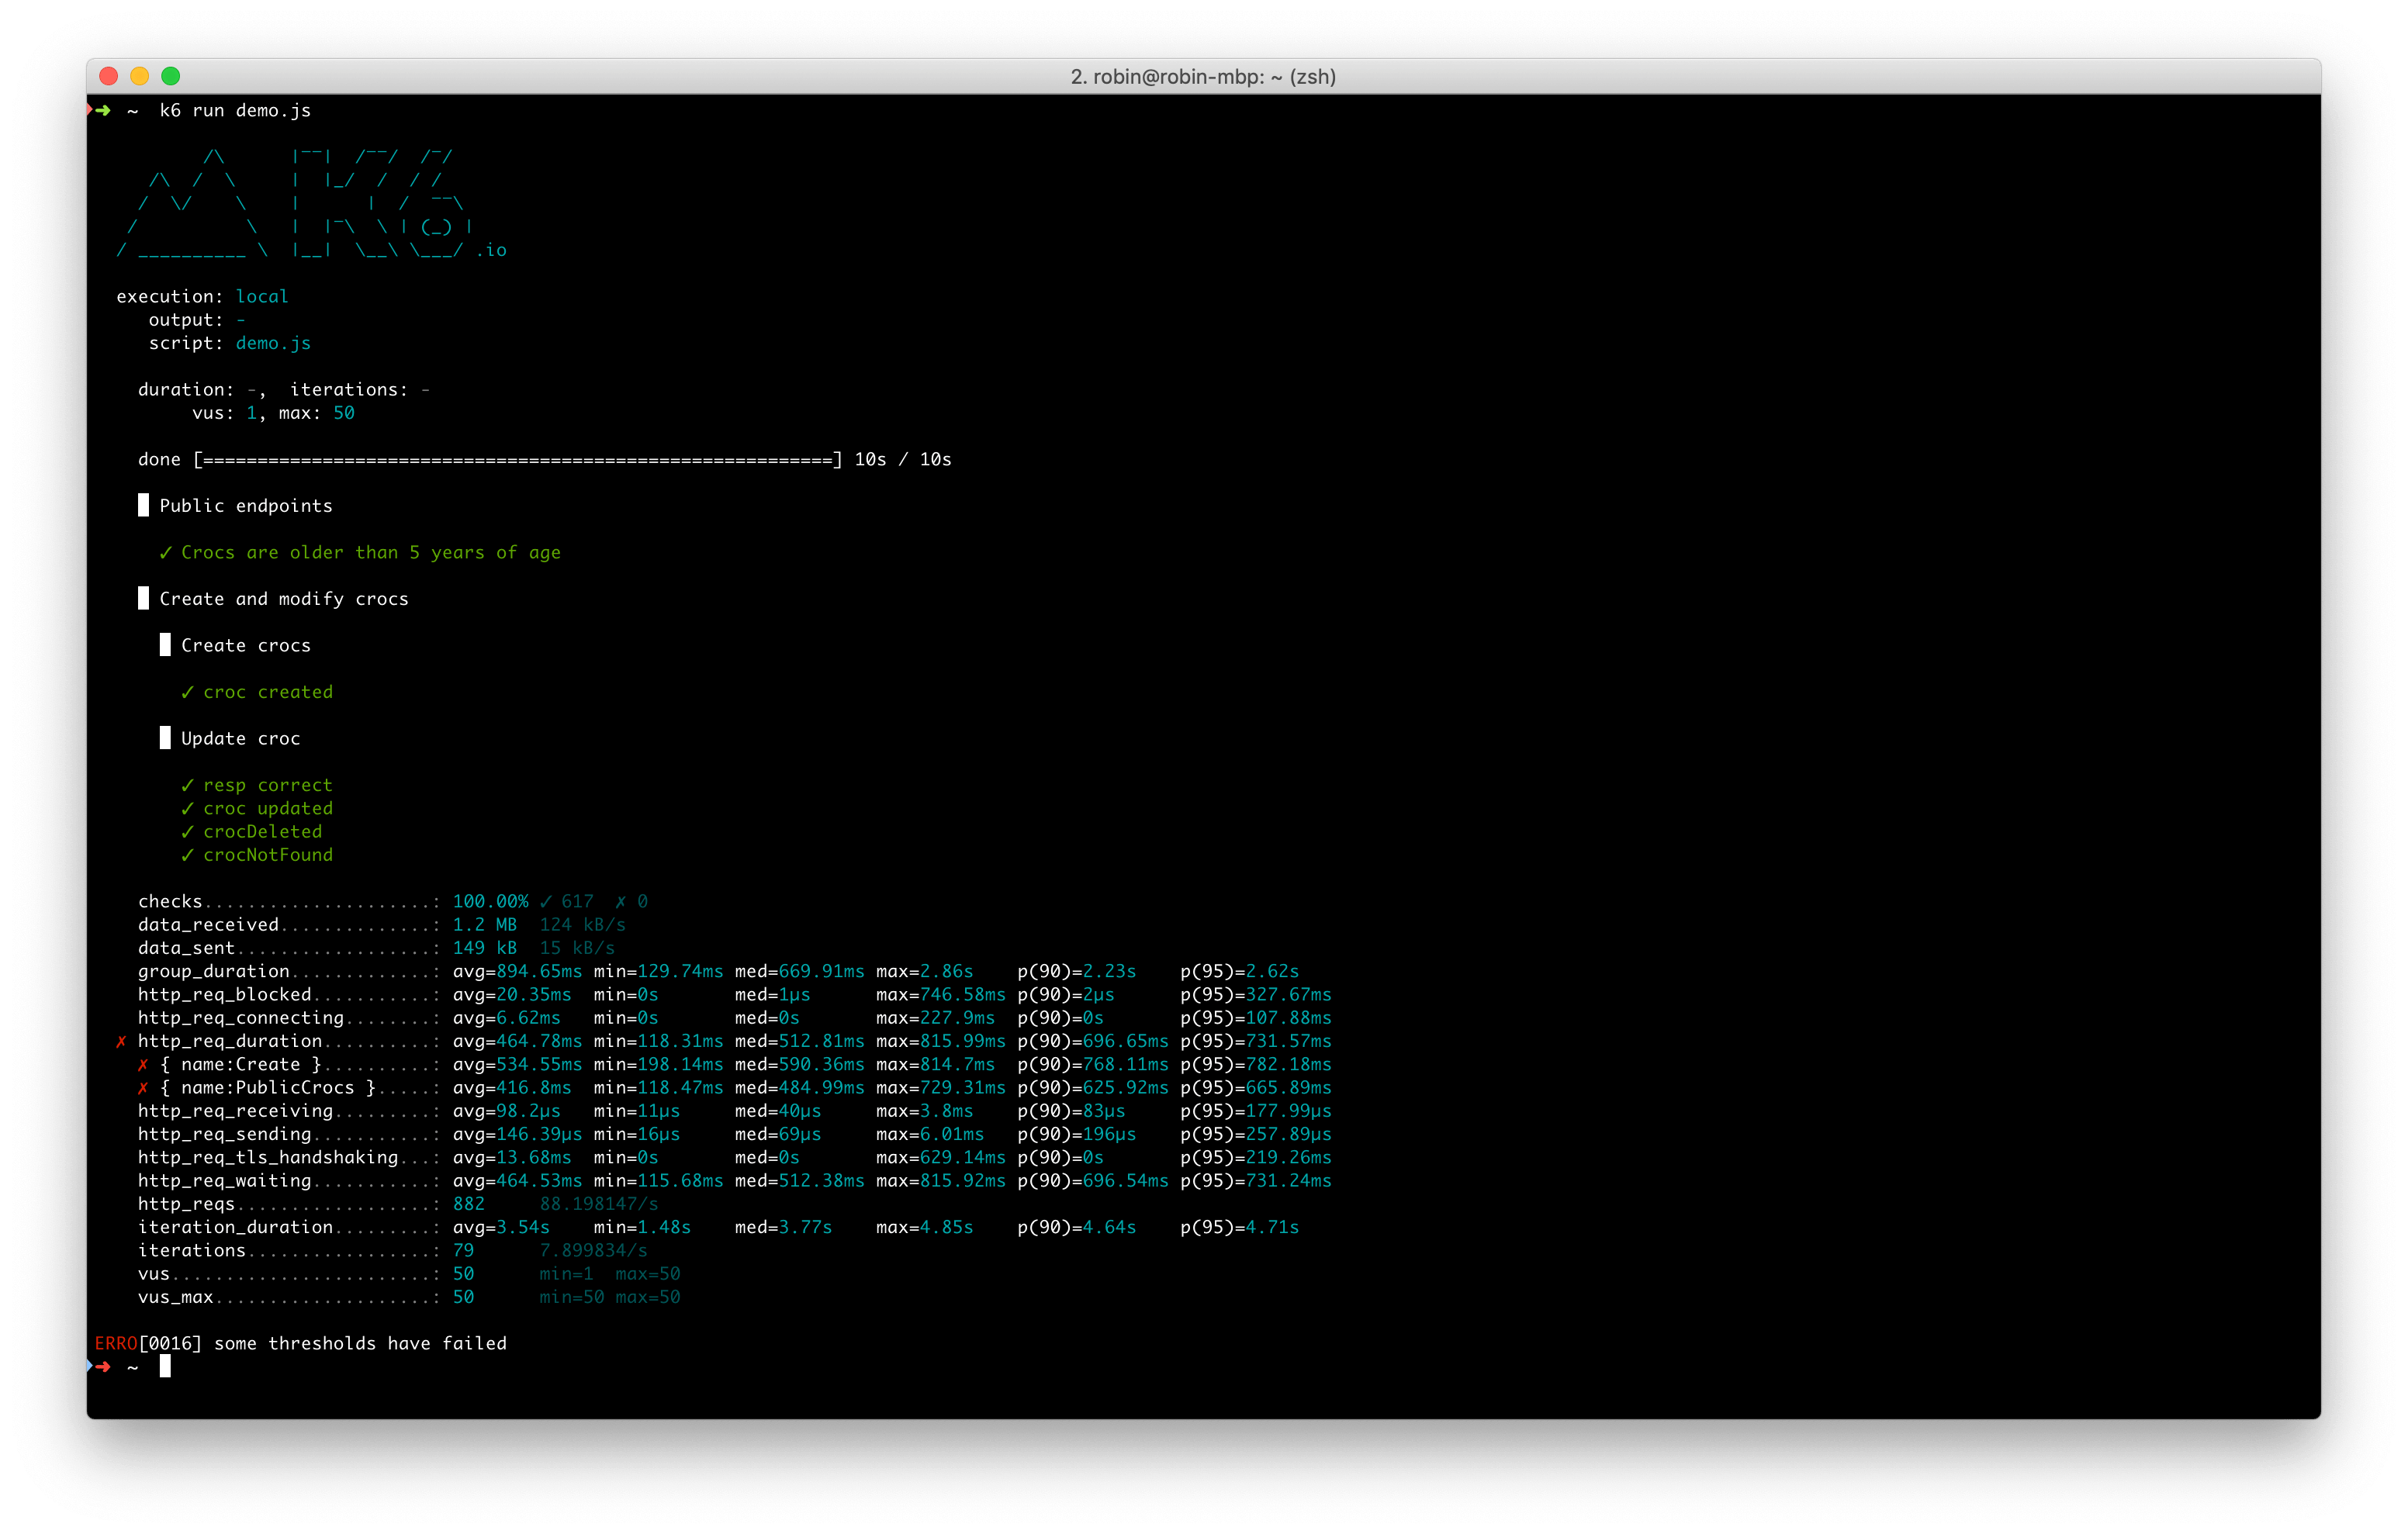
When you run a test, k6 will take the script and gradually ramp up the number of concurrent users according to your instructions in the options. You start a test using k6 run <FILENAME>. Here’s a screenshot of the terminal output you get by default when running a test:

OK, that was the console output. Now, let’s also set up InfluxDB as an output; k6 will then stream the results to InfluxDB as the test executes.
You specify InfluxDB as an output using k6 run -o influxdb=<URL_TO_INFLUXDB> <FILENAME>.

I used the community-contributed dashboard above created by Dave Cadwallader – who btw gave a great talk at GrafanaCon on teaching Grafana to his kids. Awesome!
Commercial Open Source
In addition to the open source k6 tool, which is licensed under AGPL, we built a SaaS product so that organizations don’t have to manage infrastructure and result storage themselves. When you run load tests, you need to generate a lot of synthetic traffic, so you usually need lots of servers. What we do is run that management for you. It’s similar to the Grafana Labs model of having an open source tool and a related commercial offering.
The development cycle is quite rapid nowadays. A lot of companies have hundreds or thousands of developers all pushing code. We want to help you make sure that your system is not suffering in terms of performance when you have this velocity of code being pushed through the pipeline towards the end users. We’re determined to make k6 the tool of choice for our fellow developers.
To learn more about k6, visit k6.io, and go to loadimpact.com to check out the SaaS product we built on top of it.


