How eBay Moved from Custom UIs to Grafana Plugins
In the beginning, the mission of the logging and monitoring team at eBay was simple: “to give out APIs that the developers in the company could use to instrument their applications [in order] to send logs,” Vijay Samuel said during his talk at GrafanaCon about eBay’s journey to using Grafana plugins. “We had our own developers who built out UIs for being able to search view and debug their issues. And metrics were no different from logs. We gave out a bunch of APIs to instrument the code.”
The problem, Samuel said, was that “the quality of the UI was entirely dependent on the person who’s building the UI.” The job of building some of those UIs fell on Samuel’s shoulders, and about four years ago, he found adding new graphs so painful that he decided to do a proof of concept based on Grafana.
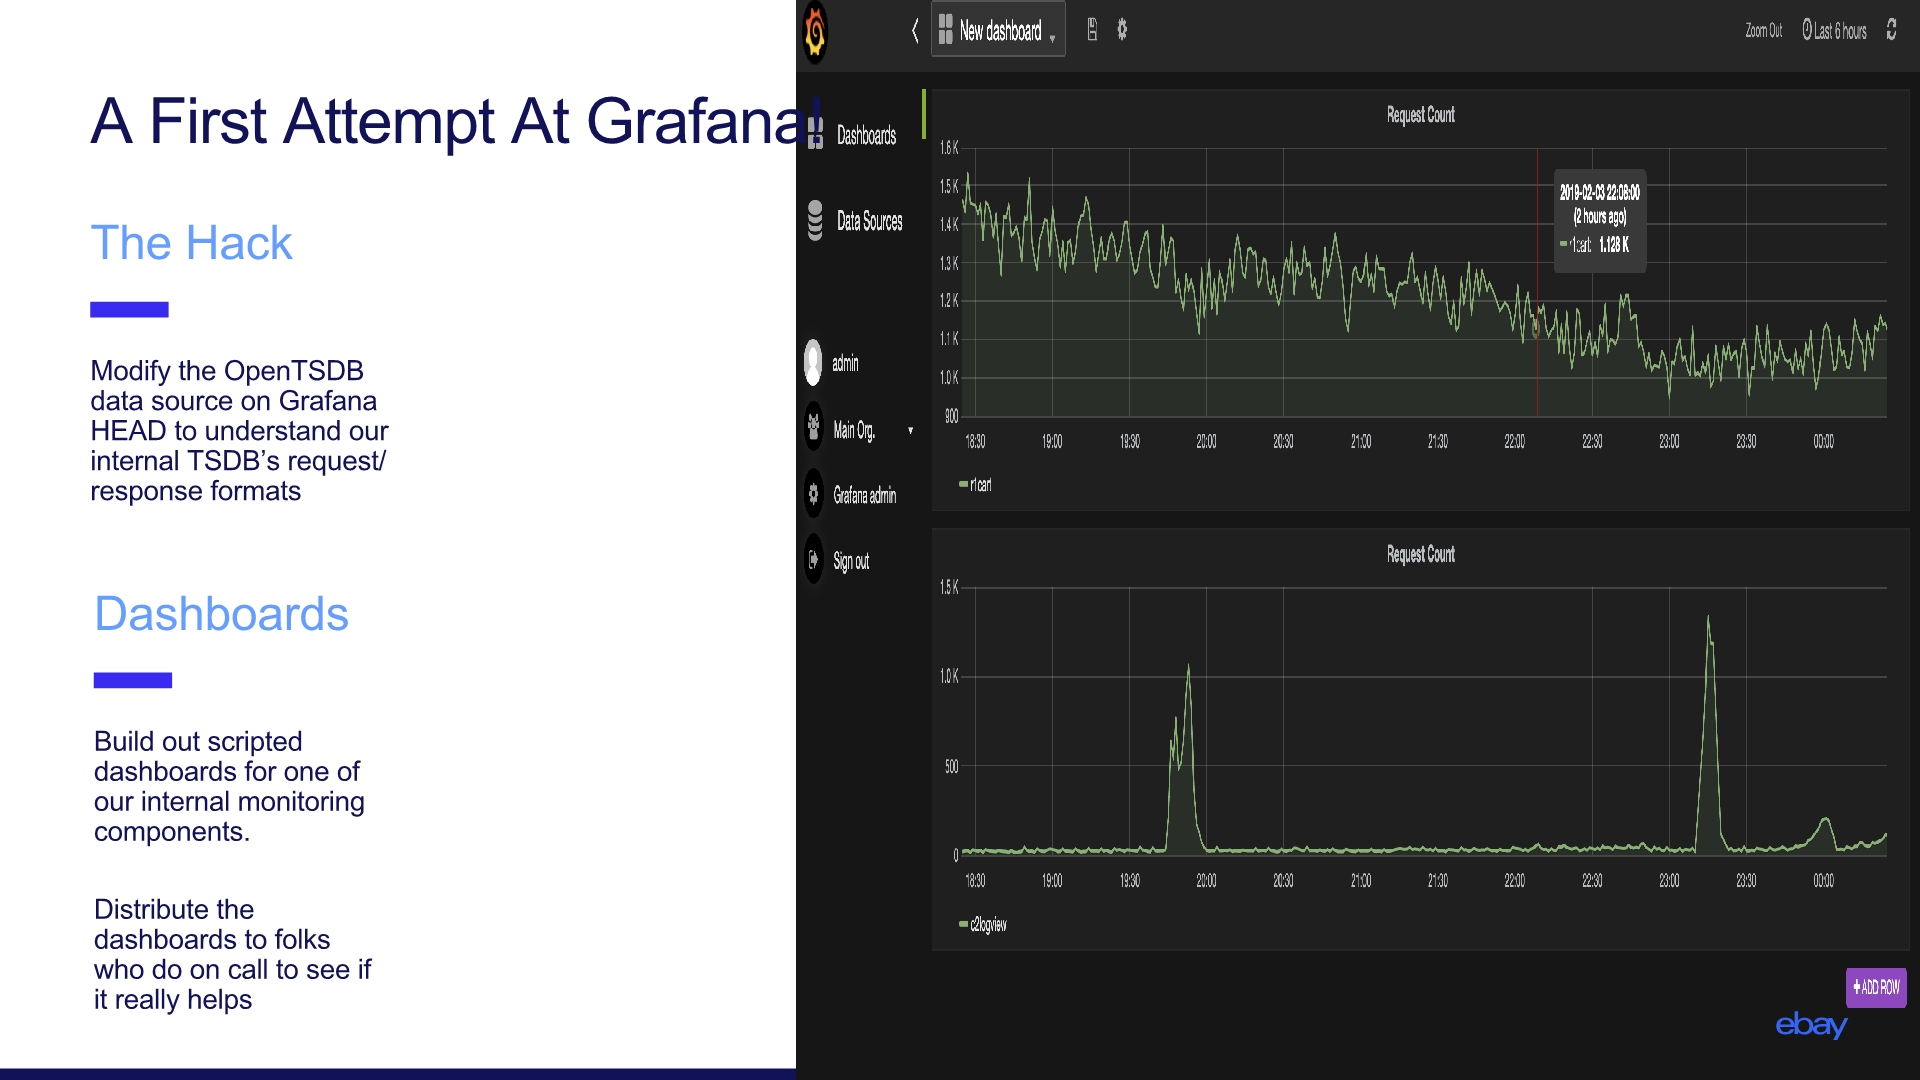
“The first attempt was a literal hack,” said Samuel, a member of the monitoring team. “I took the master branch of Grafana, and I modified the open TSDB data source to be able to understand our internal APIs. And we built out some dashboards, primarily scripted dashboards, but they didn’t have all the complex features like templating or annotations.”

Grafana was then still in v3.x, and “it was a dirty-dirty hack,” Samuel said. The PoC was used by some on-call teams, but languished until some people from the Database Ops team came and asked for Grafana support for eBay’s internal TSDB.
Building a Data Source Plugin
Samuel’s old PoC was revived, and the Database Ops team members, Steven West and Auston McReynolds, “took the dirty hack and converted it into a dedicated data source plugin, but it was still grunt-generated code,” said Samuel. “They also added Docker support to the plugin.”
Samuel took that plugin and ran with it, adding some Kubernetes deployment scripts. “Every time someone asked for Grafana support, I would point them to these Kube specs and tell them, ‘Go run it,’” he recounted. “And every time they asked for features, I would use my spare time and build out some features for that.”
The big breakthrough came when some eBay SREs, led by Satish Sambasivan, decided to scrap their work building their own custom UIs and use Grafana instead. “They took it to the next level,” said Samuel. “They started to overlay a lot of data on their graphs. For example, any change that was happening that impacted the site, they dropped them as annotations on the graph. So they were able to catch interesting issues like when a DNS flip caused errors to spike, and that was right there on the dashboard. They started providing hosted solutions.”
Later, the SRE team turned to the monitoring team to support all of this for them. “They have four golden signals, which they basically use to triage all the issues that were happening on the site, and there were many dashboards that they built,” Samuel said. “The monitoring team decided to take up Grafana as a first-class citizen in our offering. And this came with a whole new makeover.”

With seasoned UI developers working on the project, many changes were made: First off, grunt-generated files would be a thing of the past. Widgets were added to view logs and events. It would become a more robust hosted solution. A lot more features were added into Grafana, such as being able to authenticate with internal APIs, and annotations support for the data source plugin.
A Cloud Native Approach
And on the backend, custom APIs for shipping logs, metrics, and events into the platform were replaced by “more cloud native mechanisms,” to make logging and metrics simpler. For logging to log files, users could let the monitoring team know what the log files were, and they’d ship the logs. For metrics, Samuel said, “Instrument your code with Prometheus, and if you’re running on Kubernetes, provide a few annotations saying that this is the port that we’re exposing the metrics on. And we’ll be able to collect and ship it into the platform.”
Along the way, the eBay monitoring team began investing more in open source. “If you found a product to be worth investing in, and if you found gaps, we started contributing to them,” Samuel said. (One project they’ve contributed a lot to: Elastic Beats.)
At this point, Samuel said, “we’re at a place where we can say that we’re slowly changing the dynamic of monitoring inside of eBay, and Grafana is playing a big picture in all of that.”
The biggest lesson they’ve learned: “It’s always good to be a part of the community,” he said. “Anytime we saw that a feature was missing, we tried really hard to build it out in a generic way and tried to give it back to the community.”
Compared to his first painful experiences building graphs, he remarked, “now creating dashboards is easy.” In fact, eBay’s custom data source plugin was built in one day. “That’s a big testament to Grafana,” he added. “If a non-seasoned UI person like me could build it out in a day, then imagine how much power the product is giving to every developer…. Moving away from custom APIs and moving into more cloud native constructs has helped us to onboard more use cases than we could ever imagine.”
Want to watch more GrafanaCon talks? Check them out here.


