Oracle Cloud Infrastructure as a Data Source for Grafana
Developers and enterprises are increasingly concerned with vendor lock-in and cloud sprawl. Companies are reluctant to adopt new technology if it means that they may find themselves unable to migrate from one vendor due to proprietary standards. At the same time, it has become a challenge to keep track of and managing an ever-growing list of providers and services. With that in mind, Oracle made data and metrics from Oracle Cloud Infrastructure service accessible to analyze and instrument with open source tools. We chose Grafana, the leading open source platform for analytics and monitoring, because of its popularity in the industry and the significant amount of demand it has generated amongst Oracle Cloud Infrastructure customers.
We are excited to announce the availability of the Oracle Cloud Infrastructure Data Source for Grafana. Grafana is an open source visualization and alerting tool for time series data. It was designed with a plugin architecture that allows you to capture data across many different sources and visualize it on a single dashboard. This approach addresses the issue of cloud sprawl, by providing a consolidated view of resources across providers.
Oracle offers out of the box aggregated metrics for Oracle Cloud Infrastructure services and resources. It also provides you with the ability to discover and retrieve metrics from via API. We worked closely with the team at Grafana to develop the plugin. This development effort was complemented by the work done to leverage the open source technology Prometheus within Oracle Cloud Infrastructure. By exposing the Oracle Cloud Infrastructure API as a Grafana data source you can visualize Oracle Cloud Infrastructure data in your Grafana instance and use it to create beautiful and useful dashboards.
Getting Access to the Plugin
To install the data source make sure you are running Grafana 6.0 or later. Use the grafana-cli tool to install the Oracle Cloud Infrastructure Data Source for Grafana from the command line:
grafana-cli plugins install oci-datasourceThe plugin will be installed into your Grafana plugins directory, which by default is located at /var/lib/grafana/plugins. More information on the cli tool. Alternatively, if you are running an earlier version of Grafana, you can manually download the .zip file and unpack it into your /grafana/plugins directory.
Authenticate with the Oracle Cloud Infrastructure CLI
To pull metrics into Grafana we need to first authenticate against the Oracle Cloud Infrastructure API. To do so, we will use the Oracle Cloud Infrastructure CLI to authenticate between our local environment hosting Grafana and Oracle Cloud Infrastructure. The CLI is built on Python (version 2.7.5 or 3.5 or later), running on Mac, Windows, or Linux. This tool provides you with a way to perform tasks in Oracle Cloud Infrastructure from your command line rather than the Oracle Cloud Infrastructure Console. It does so by making REST calls.
Begin by installing the Oracle Cloud Infrastructure CLI. Follow the installation prompts to install the CLI on your local environment. After the installation is complete, use the oci setup config command to have the CLI walk you through the first-time setup process. This will prompt you for various credentials related to your Oracle Cloud Infrastructure tenancy including a public API signing key. If you have not already uploaded your public API signing key through the console, follow the instructions here to do so. This information should come from the same user for whom you created the policy above.
Identity and Access Management
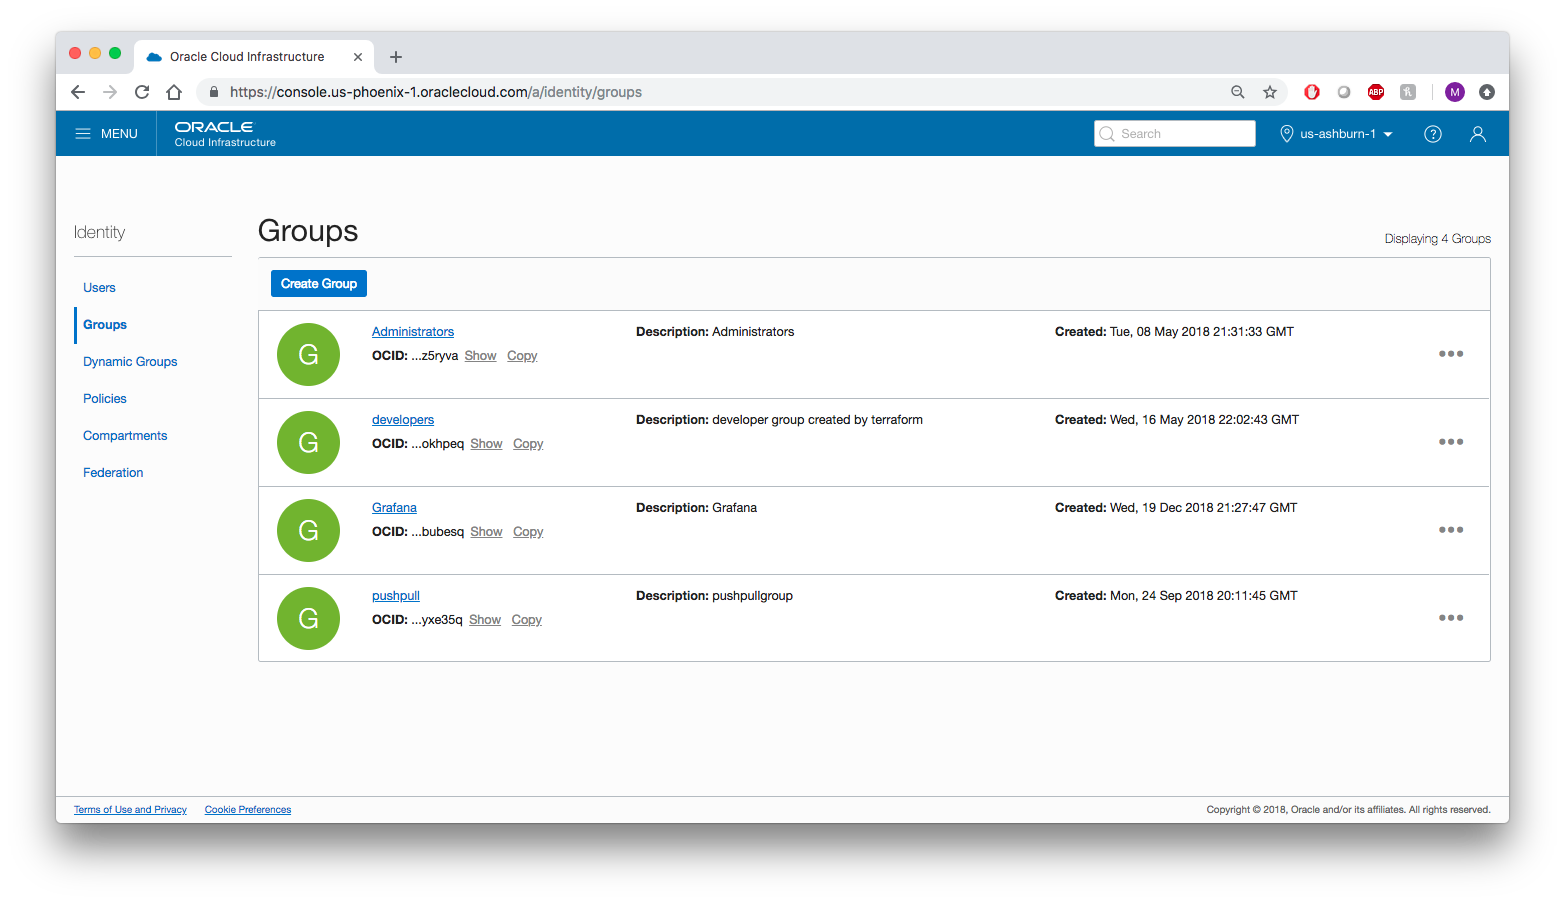
In order to pull metrics into Grafana we need an Oracle Cloud Infrastructure user with proper permissions. In the Oracle Cloud Infrastructure console under Identity > Groups click Create Group and create a new group called grafana. Add the user configured in the Oracle Cloud Infrastructure CLI to the newly-created group.

Make sure you are in the root compartment. Under the Policy tab click Create Policy and create a policy allowing the group to read metrics from your tenancy. Add the following policy statements:
allow group grafana to read metrics in tenancyallow group grafana to read compartments in tenancy

Configure Grafana
Log into Grafana and on the Home Dashboard, click the gear icon on the left side of the page, and then click Add data source.

Choose oracle-oci-datasource as your data source type.

Fill in your Tenancy OCID, Default Region, and Environment. For Environment choose local.

Click Save & Test to return to the home dashboard.
Query Editor
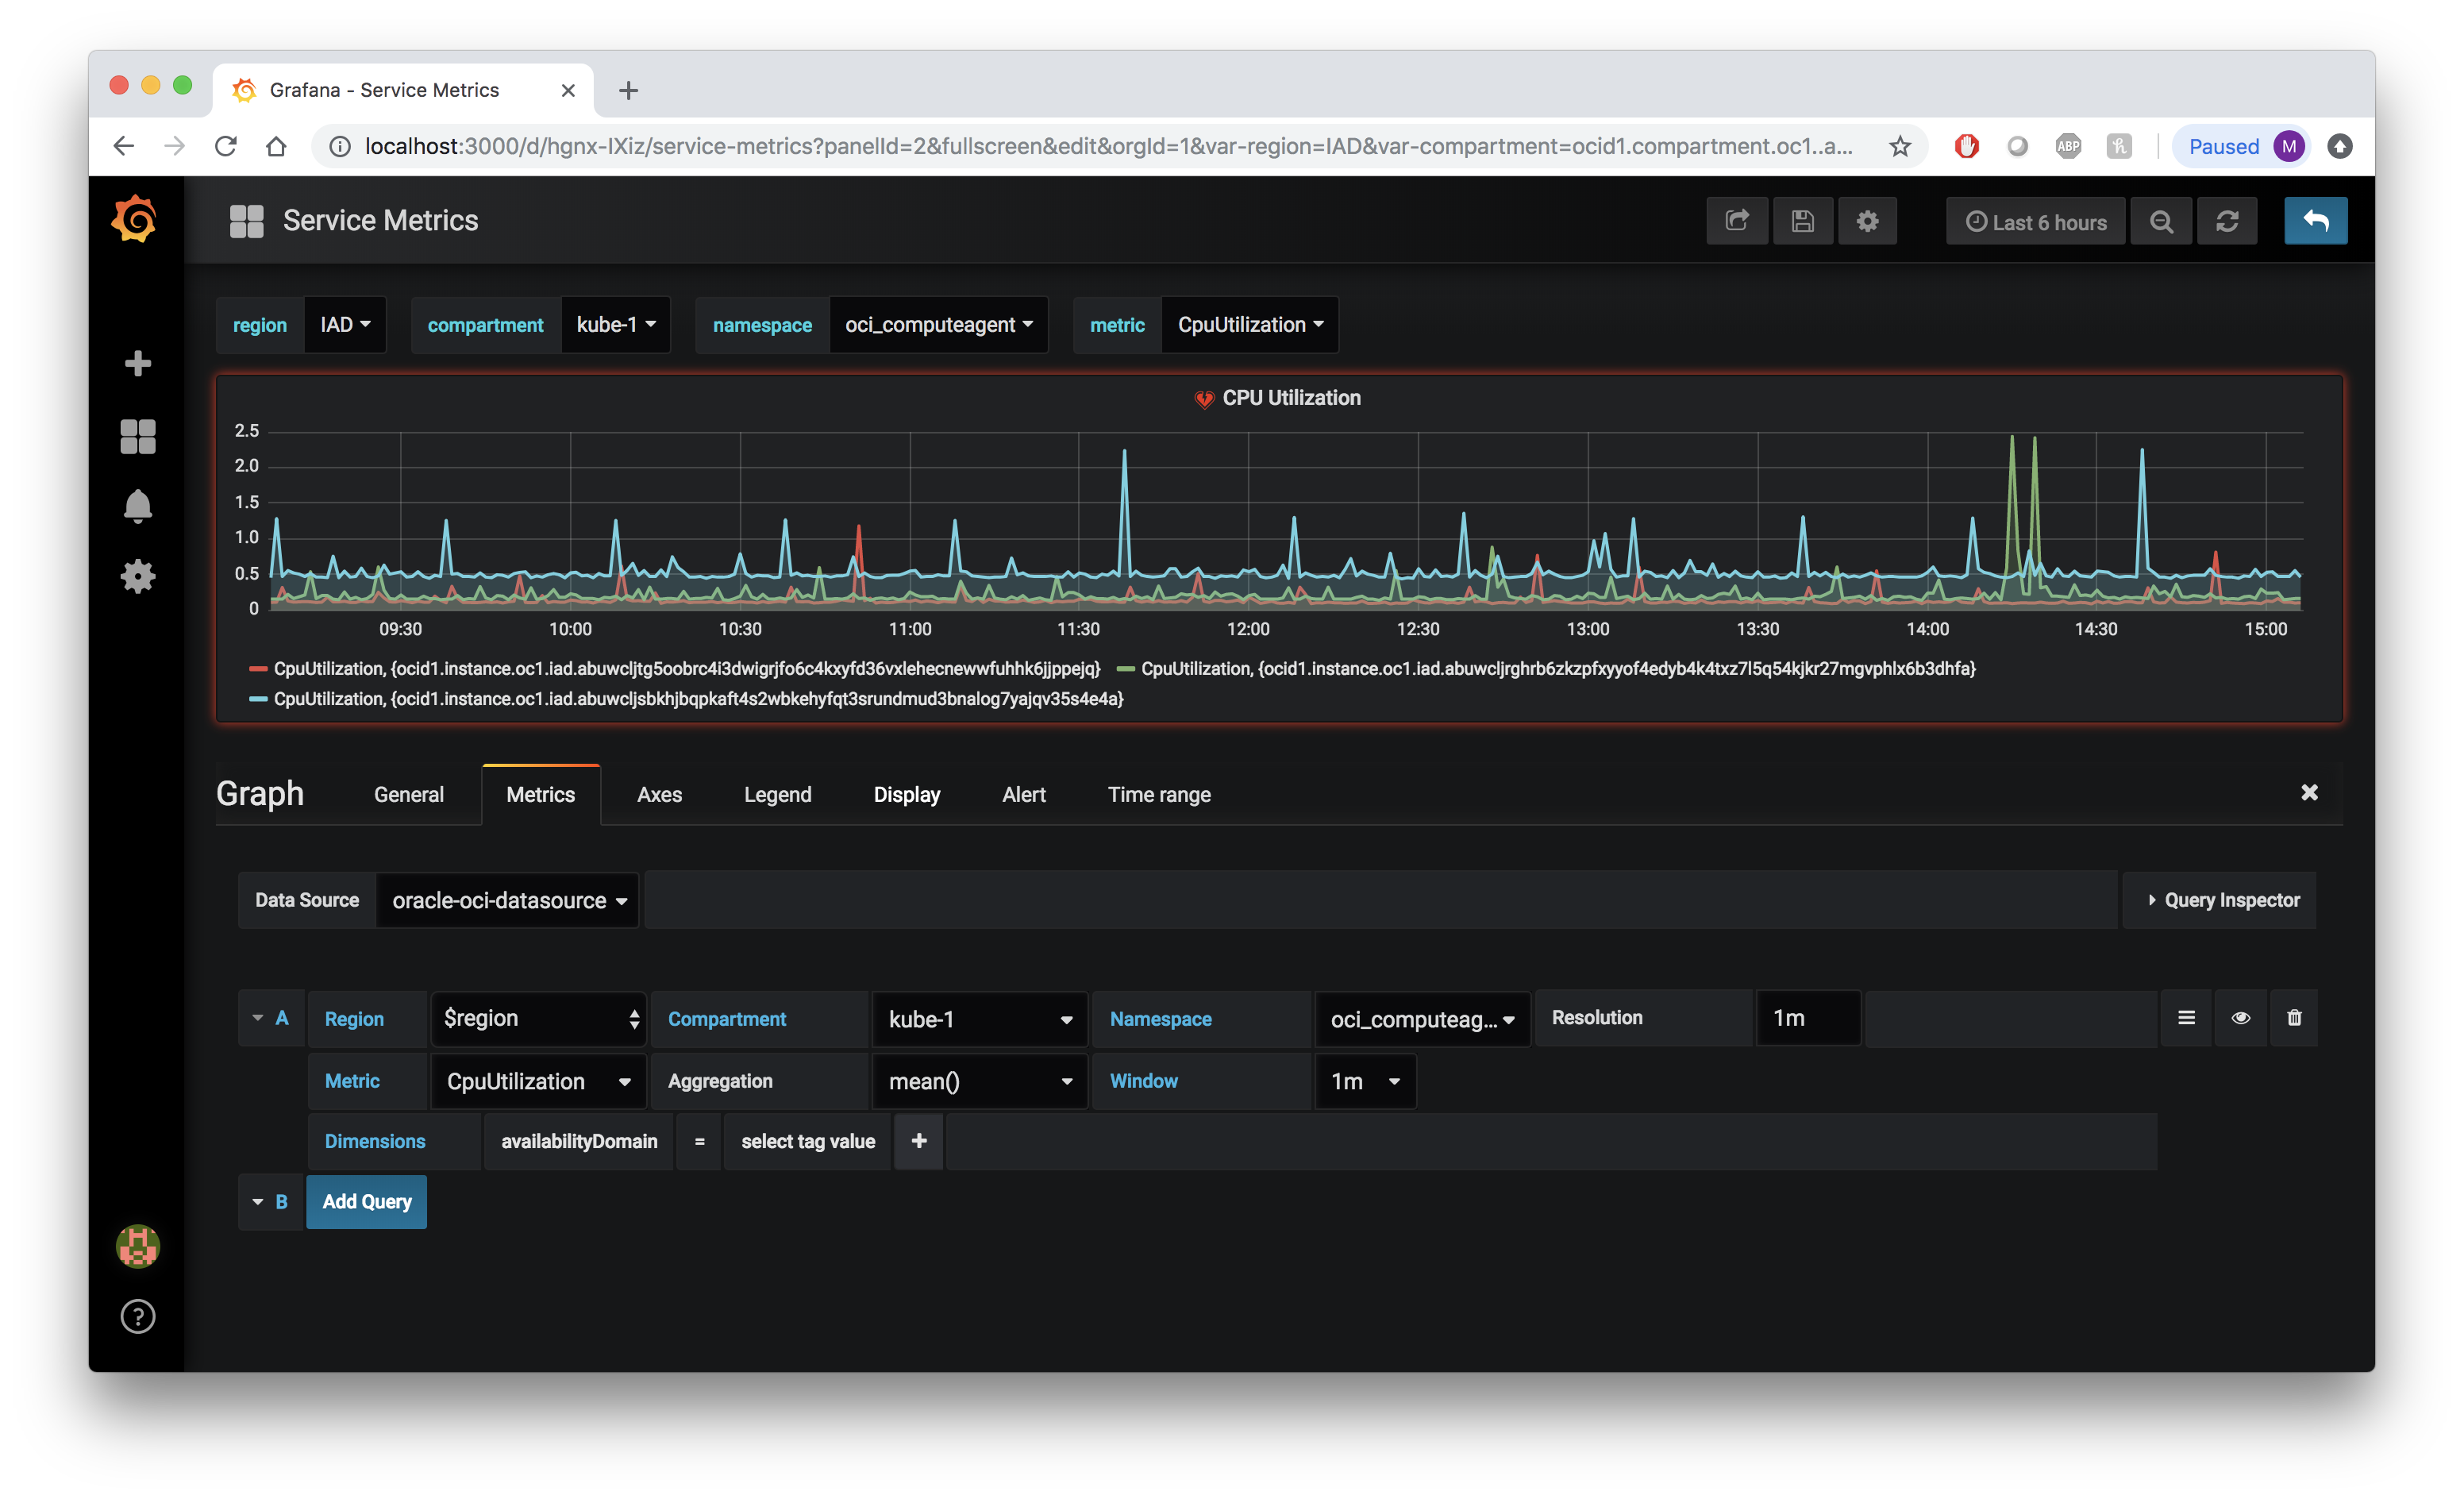
After configuring the plugin, you will be able to use the query editor to create graphs of your Oracle Cloud Infrastructure resources. Navigate back to the Home Dashboard and click New Dashboard. Choose Graph from the list of available dashboard types. Click Panel Title and then Edit to add metrics to the dashboard. Choose the appropriate Region, Compartment, Namespace, and Metric from the list of available options.

Dimensions
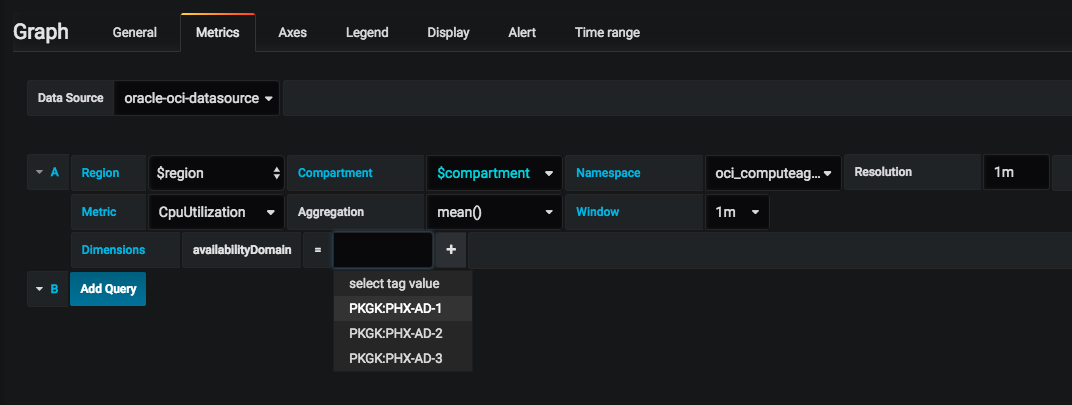
Dimensions can be used to add specificity to your graphs. To use dimensions create a new graph or navigate to an existing one and click the Metrics tab. After selecting your variables click the + next to Dimensions and select one of the tag filters from the list. For example, select availabilityDomain from the list. Next, click select tag value and choose from the newly populated list of tag values. If you chose availabilityDomain as your tag filter, you should see tag values corresponding to the availability domains in which you currently have services provisioned, for example US-ASHBURN-AD-1.

Templating
Dashboard Templating enables you to dynamically interact with graphs. This makes it easy to change graphs on the fly to visualize additional information about your environment. Using the query template will create a dynamic list of variables to choose from, allowing for users to quickly switch between regions or compartments or other variable as seen in the example below.

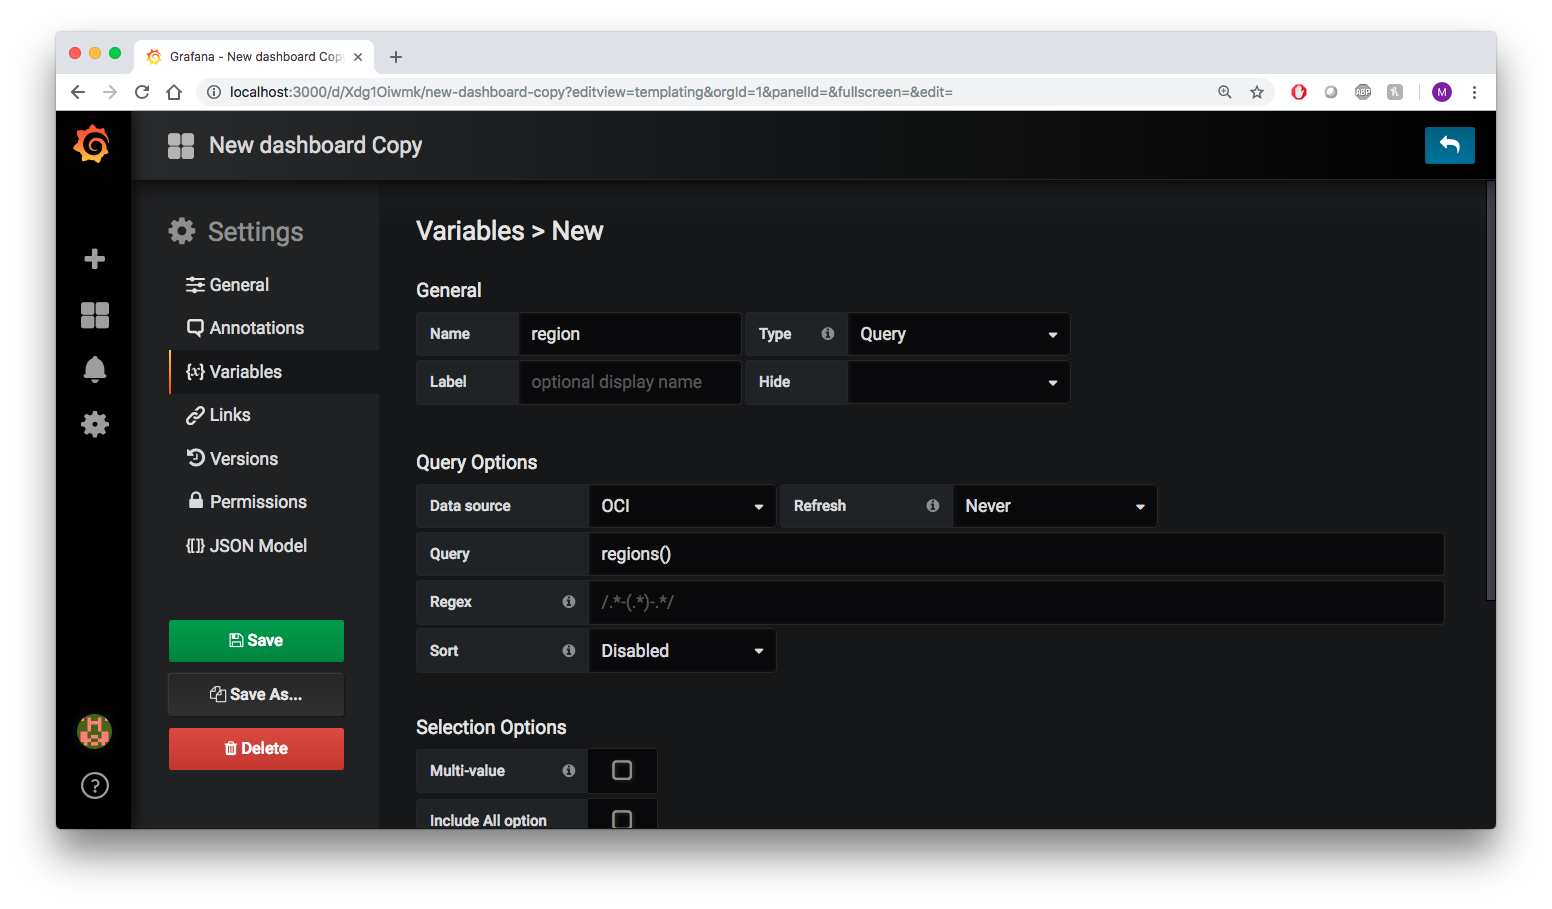
In order to configure templating, click on the gear icon in the upper right corner of the dashboard creation page from the previous step. This will take you to the Settings page. Click the Variables tab and then click the Add variable button. Add the region variable to this page. Give the variable the name region, choose oracle-oci-datasource from the list of data sources, and for Query enter regions().

You can also see two custom metrics CustomMetric and CustomMetric2 from the Metric dropdown.
The page will load a preview of values available for that variable. Scroll down and click Add to create a template variable for regions. Repeat the process for the following Oracle Cloud Infrastructure variables:
| Name | Query |
|---|---|
| region | regions() |
| compartment | compartments() |
| namespace | namespaces() |
| metric | metrics($namespace,$compartment) |
The final result will look like this:

Custom Metrics and Namespaces
Oracle Cloud Infrastructure allows for the creation of custom metrics namespaces, which can be used to ingest data from sources in addition to the native Oracle Cloud Infrastructure resources available by default. For example, an application could be instrumented to gather statistics about individual operations. The resource posting custom metrics must be able to authenticate to Oracle Cloud Infrastructure using either using the Oracle Cloud Infrastructure CLI authentication mentioned above or using instance principals. In the example below you can see the option to select custom_namespace from the Namespace drop down.

You can also see two custom metrics CustomMetric and CustomMetric2 from the Metric dropdown.

You can find more information about using the solution on the Oracle Cloud Infrastructure Data Source for Grafana page on the Grafana Labs site and a Readme with links to detailed installation walkthroughs on the Oracle Cloud Native Labs page. For more information about Oracle’s contributions to the open source and cloud native space, head over to http://cloudnative.oracle.com/.


