Grafana v5.1 Released
The recent 5.0 major release contained a lot of new features so the Grafana 5.1 release is focused on smoothing out the rough edges and iterating over some of the new features.
Release Highlights
There are two new features included, Heatmap Support for Prometheus and a new core data source for Microsoft SQL Server.
Another highlight is the revamp of the Grafana docker container that makes it easier to run and control but be aware there is a breaking change to file permissions that will affect existing containers with data volumes.
We got tons of useful improvement suggestions, bug reports and Pull Requests from our amazing community. Thank you all! See the full changelog for more details.
- Improved scrolling experience
- Improved docker image with a breaking change!
- Heatmap support for Prometheus
- Microsoft SQL Server as metric & table datasource!
- Copy and paste for panels and other improvements when adding panels to dashboards
- Align Zero-Line for Right and Left Y-axes in the Graph Panel
Improved Scrolling Experience
In Grafana v5.0 we introduced a new scrollbar component. Unfortunately this introduced a lot of issues and in some scenarios removed the native scrolling functionality. Grafana v5.1 ships with a native scrollbar for all pages together with a scrollbar component for the dashboard grid and panels that does not override the native scrolling functionality. We hope that these changes and improvements should make the Grafana user experience much better!
Improved Docker Image
Grafana v5.1 brings an improved official docker image which should make it easier to run and use the Grafana docker image and at the same time give more control to the user how to use/run it.
We have switched the id of the grafana user running Grafana inside a docker container. Unfortunately this means that files created prior to 5.1 will not have the correct permissions for later versions and thereby introduces a breaking change. We made this change so that it would be easier for you to control what user Grafana is executed as.
Please read the updated documentation which includes migration instructions and more information.
Heatmap Support for Prometheus

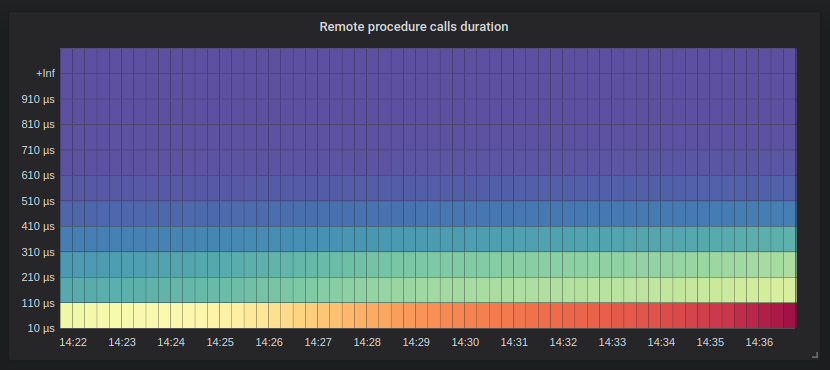
The Prometheus datasource now supports transforming Prometheus histograms to the heatmap panel. The Prometheus histogram is a powerful feature, and we’re really happy to finally allow our users to render those as heatmaps. The Heatmap panel documentation contains more information on how to use it.
Another improvement is that the Prometheus query editor now supports autocomplete for template variables. More information in the Prometheus data source documentation.
Microsoft SQL Server

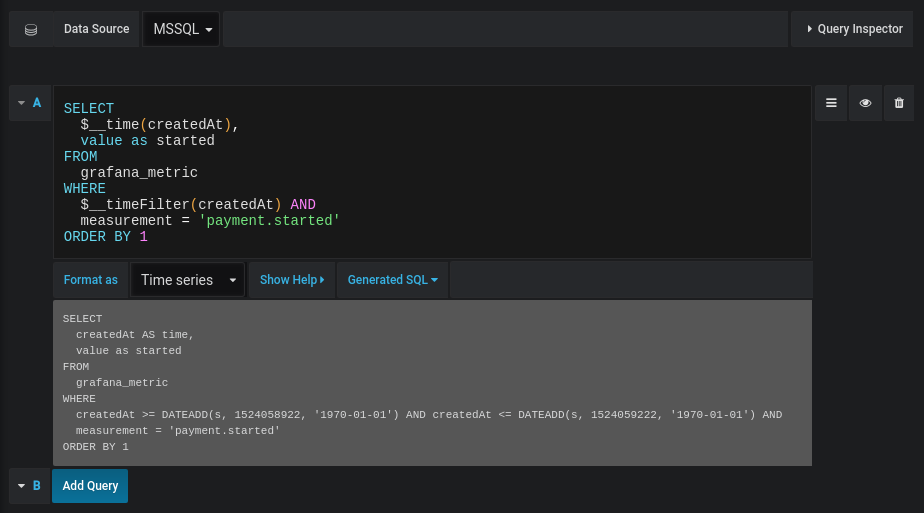
Grafana v5.1 now ships with a built-in Microsoft SQL Server (MSSQL) data source plugin that allows you to query and visualize data from any Microsoft SQL Server 2005 or newer, including Microsoft Azure SQL Database. Do you have metric or log data in MSSQL? You can now visualize that data and define alert rules on it as with any of Grafana’s other core datasources.
The using Microsoft SQL Server in Grafana documentation has more detailed information on how to get started.
Adding New Panels to Dashboards
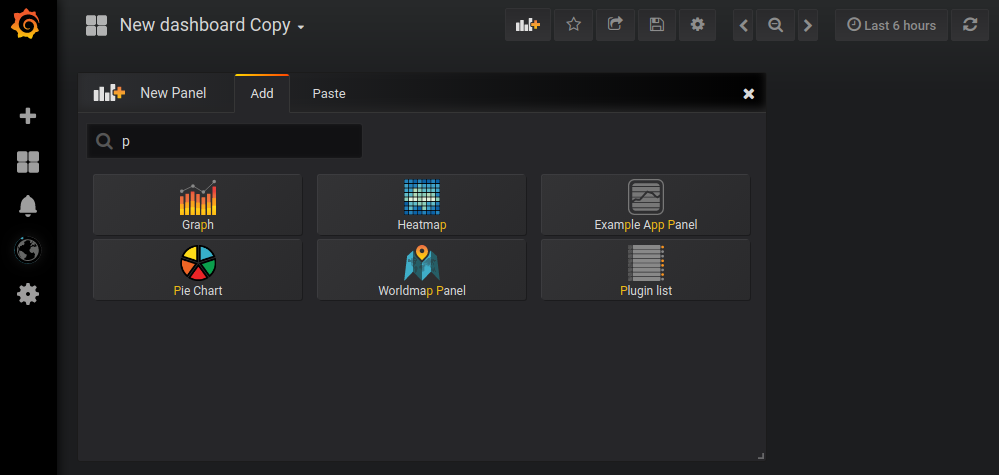
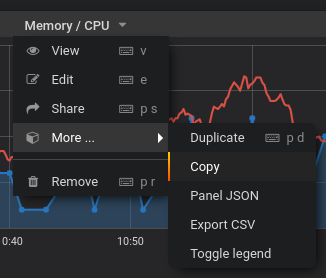
The control for adding new panels to dashboards now includes panel search and it is also now possible to copy and paste panels between dashboards.
By copying a panel in a dashboard it will be displayed in the Paste tab. When you switch to a new dashboard you can paste the
copied panel.


Align Zero-Line for Right and Left Y-axes
The feature request to align the zero-line for right and left Y-axes on the Graph panel is more than 3 years old. It has finally been implemented - more information in the Graph panel documentation.
Other Highlights
- Table Panel: New enhancements includes support for mapping a numeric value/range to text and additional units. More information in the Table panel documentation.
- New variable interpolation syntax: We now support a new option for rendering variables that gives the user full control of how the value(s) should be rendered. More details in the in the Variables documentation.
- Improved workflow for provisioned dashboards. More details here.
Changelog
Checkout the CHANGELOG.md file for a complete list of new features, changes, and bug fixes.


