How to interpret your load test results
When you look at load testing results, you will first want to start with the main graph — you can derive a lot of information from it!
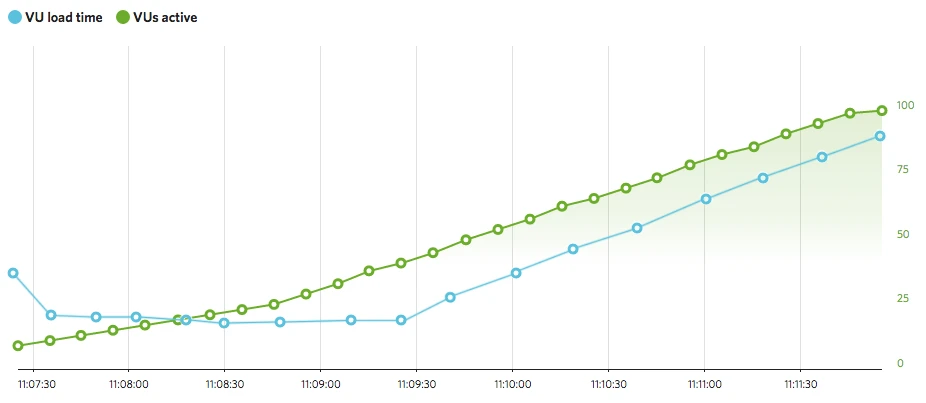
By default, we will plot two metrics: virtual users (VUs) and virtual user load time. By definition VU load time is a measure of how long it takes a virtual user to make all the HTTP requests during an iteration of the user scenario they are assigned to. If you are running a simple URL test with your load testing tool, you’ll probably get results in milliseconds. If you recorded a long journey with our Chrome extension, you may be looking at minutes.
Looking for trends
So knowing this, it’s best to actually totally ignore the units of measure and instead look for trends. For example:
Flat VU load time and increasing VUs. This signals that the system under test (SUT) is stable with increasing concurrent users. Overall, a signal that performance is good, but we don’t stop here!

Increasing VU load time and increasing VUs. This signals that the SUT is degrading with increasing concurrent users. Overall, this is a strong signal that a performance problem exists.

After analyzing the main graph, you’ll want to dig a little deeper, either to confirm your initial findings or to uncover some other clues. At this point it really becomes a “choose your own adventure” novel based on what you are learning or what makes sense to look at next. But next, let’s go through a common flow.
Check your graphs
Scroll down to the small graphs. You want to look at bandwidth, load gen CPU and load gen memory. Take a quick peek at the load gen health metrics. Generally speaking, if either is above 50%, it’s a sign that the test may be too aggressive for the load generators and skewing your results.
Our VUs can be overachievers, so if you ask one to make 1 million requests per second, they will try (and fail miserably — poor little virtual user). The most common times you will experience this is with an aggressive script or a test with a large number of VUs. This is where small inefficiencies grow into problems. (Doesn’t this sound like what you may be running tests for on your system?)
If you are seeing over utilization of the load generator, it’s best to stop and take a step back. Reanalyze your script and/or test configuration. Since it’s not terribly difficult to find yourself in this situation, we share best practices on the topic in our knowledge base here.
The different metrics
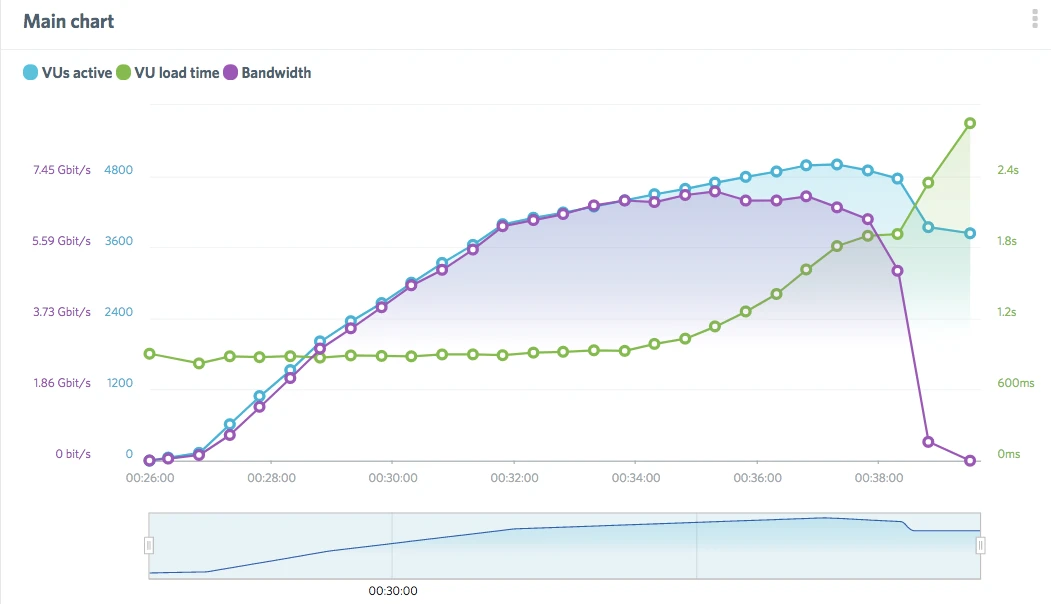
If the load generators are stable (and they usually are), let’s look to make correlations with the metrics available. Bandwidth can be a good indicator, as VUs increase do you maybe see bandwidth plateau? That could be a sign of a network bottleneck! If you’ve already installed either our open source Server Monitoring Agents or have integrated our platform with New Relic, you can pull these data points right into your test result data set. Does CPU utilization of the SUT reach high usage with your increasing load times? Maybe that’s a performance bottleneck you are running into.
Here we can see the quick rise in VU load time right at about the same time that bandwidth flattens out. This suggests a possible network-level issue is causing the degrading performance.

The URL tab
So moving forward, you’ve probably noticed the URL and Pages tabs. It’s worth peeking in here regardless of results so far.

The URL tab will show all the individual resources requested during a test. Do any URLs have a large spread of min and max load times? Are you receiving the expected response for all requests? This is definitely one place where a bad result could be hidden. For example, what if requests started failing, but quickly and consistently? This behavior would most likely result in a flat VU load time. But, if all the requests have unexpected status codes, that’s not a good result!
Taking this a step further, you can also add any of these individual metrics to the main graph for further analysis or correlation. Maybe you know that one of your requests triggers a DB call, meanwhile, a server monitoring agent on that DB shows high memory utilization when load times increase. Well, wouldn’t that be interesting.
The Pages tab
Onward to the Pages tab. Looking back to scripting, if the concept of pages is relevant to what you are testing, it’s recommended to make use of http.page_start() and http.page_end() in your script. If you’ve recorded a script with our Chrome extension, we will automatically add these in with generic names like Page 1, Page 2, etc. Changing this to something more contextual makes analysis here a bit easier.
Assuming you’ve done that, you’ll find this tab easy to navigate and similar to the URL tab. You can basically look at this as load times for individual pages. It’s a step in granularity between what’s reported on the URL tab and VU load time. You’ll want to follow a similar process as the URL tab, looking for large differences in min and max load times, as well as looking for correlations if something is interesting.
Conclusion
Consistent, continuous performance testing will illuminate other issues before your heaviest traffic makes them showstoppers. Once you’ve gotten your systems to perform like you want, it’s as easy as one, two, three with the Thresholds, CLI, and Notifications features in Load Impact. These will help you find those performance issues, before your customers do.
Happy testing!
Grafana Cloud is the easiest way to get started with Grafana k6 and performance testing. We have a generous forever-free tier and plans for every use case. Sign up for free now!


