Project Update & GrafanaCon
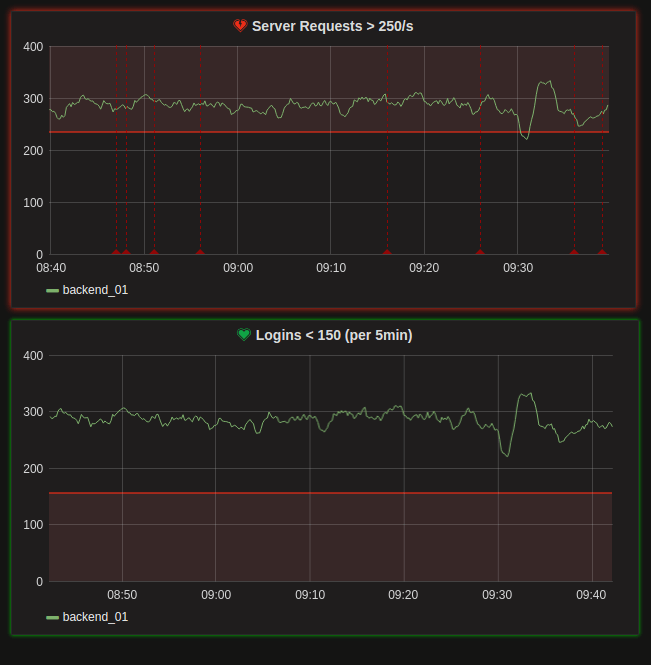
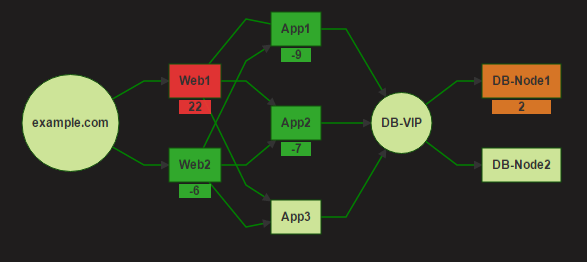
I know many are awaiting the next Grafana release, which will include the long anticipated alerting feature along with many other improvements. Besides data visualization, we hope alerting will be a fundamental feature in Grafana; a feature that will continue to evolve and improve for many years. That is why we have really taken the time get the design of the alert rule model and execution engine as solid and future proof as possible.
We are busily working on making a beta release by the end of October and stable release by GrafanaCon! You can already try it out in the nightly builds.
GrafanaCon in New York (Nov 30 - Dec 1)

Join the Grafana team, along with hundreds of monitoring and data aficionados, for our second annual
GrafanaCon on Wednesday, November 30 and Thursday, December 1, 2016. This two-day event will feature content
and speakers from across the Grafana community, led by myself, Torkel Ödegaard, the creator & project lead of Grafana.
Day 1 will be single track format, several talks & panels of general interest; while day 2 lets you roll up your sleeves in a dual track format for more detailed topics and deeper dives. There will also be a Plugin Lounge with projects from across the Grafana ecosystem including Prometheus, Graphite, InfluxDB, worldPing, Intel, Kentik, Voxter and others.
Registration includes full access to both days, an after-party, and refreshments.
If you’re interested in presenting at GrafanaCon, there’s still time to submit your proposal.
The venue and preliminary speaker schedule will be announced shortly.
Go to GrafanaCon.org and register for an early bird ticket.
Pre-register Now
New Screencasts
Ep 9 - Elasticsearch
Ep 10 - Dashboard sharing and discovery
New Plugins
New panels, data sources and apps are constantly being added to the Plugins Repository on Grafana.net. Here are some recent additions.

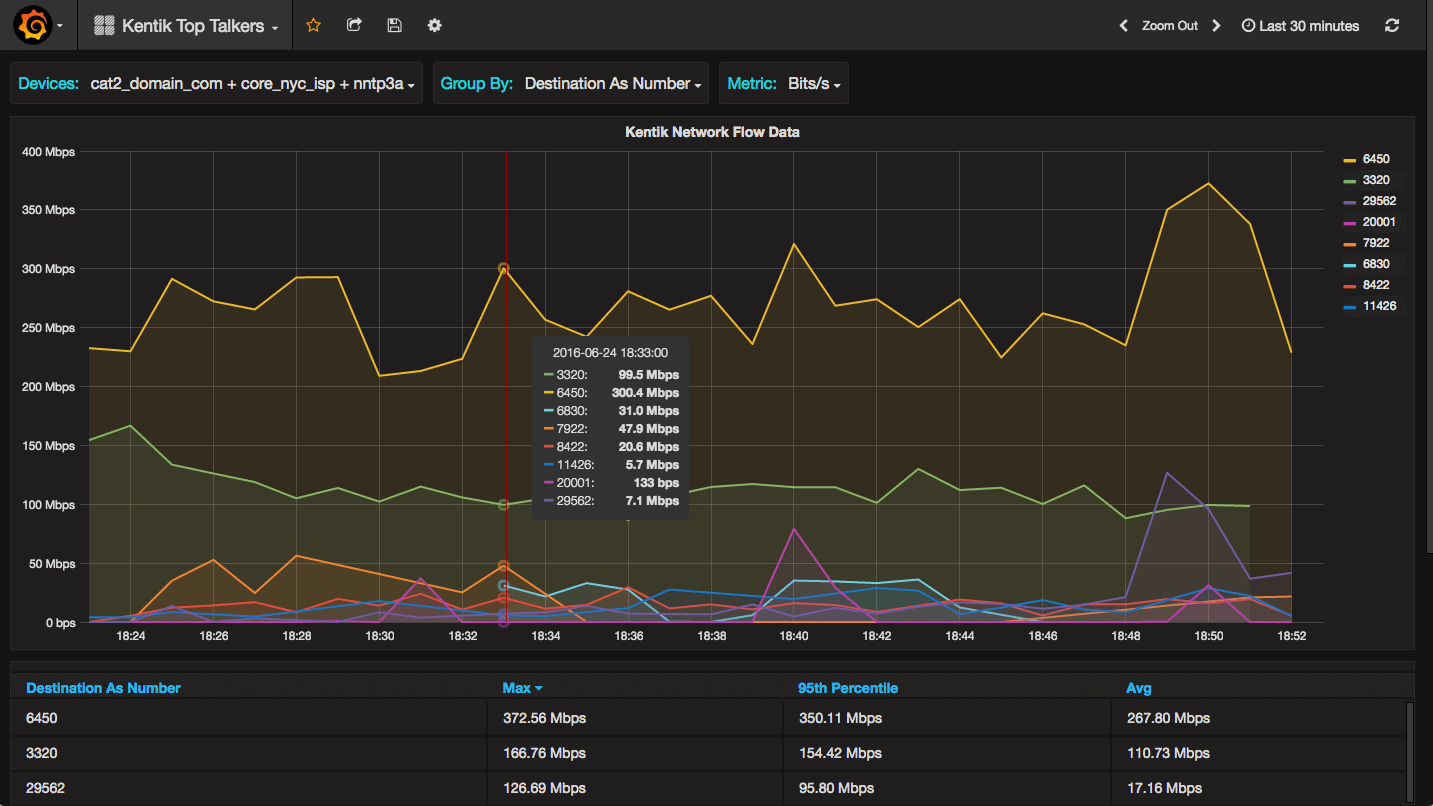
<a href="https://grafana.net/plugins/kentik-app?utm_source=Grafana_blog">Kentik Connect Pro</a>
 allows you to quickly and easily enhance your visibility into your network traffic. Kentik Connect leverages the power of Kentik Detect, which provides real-time, Internet-scale ingest and querying of network data including flow records (NetFlow, IPFIX, sFlow), BGP, GeoIP, and SNMP.
<br>
New Dashboards
The Dashboard Repository on Grafana.net is rapidly becoming treasure trove of ready made reusable dashboards for all kinds of collectors and data sources.
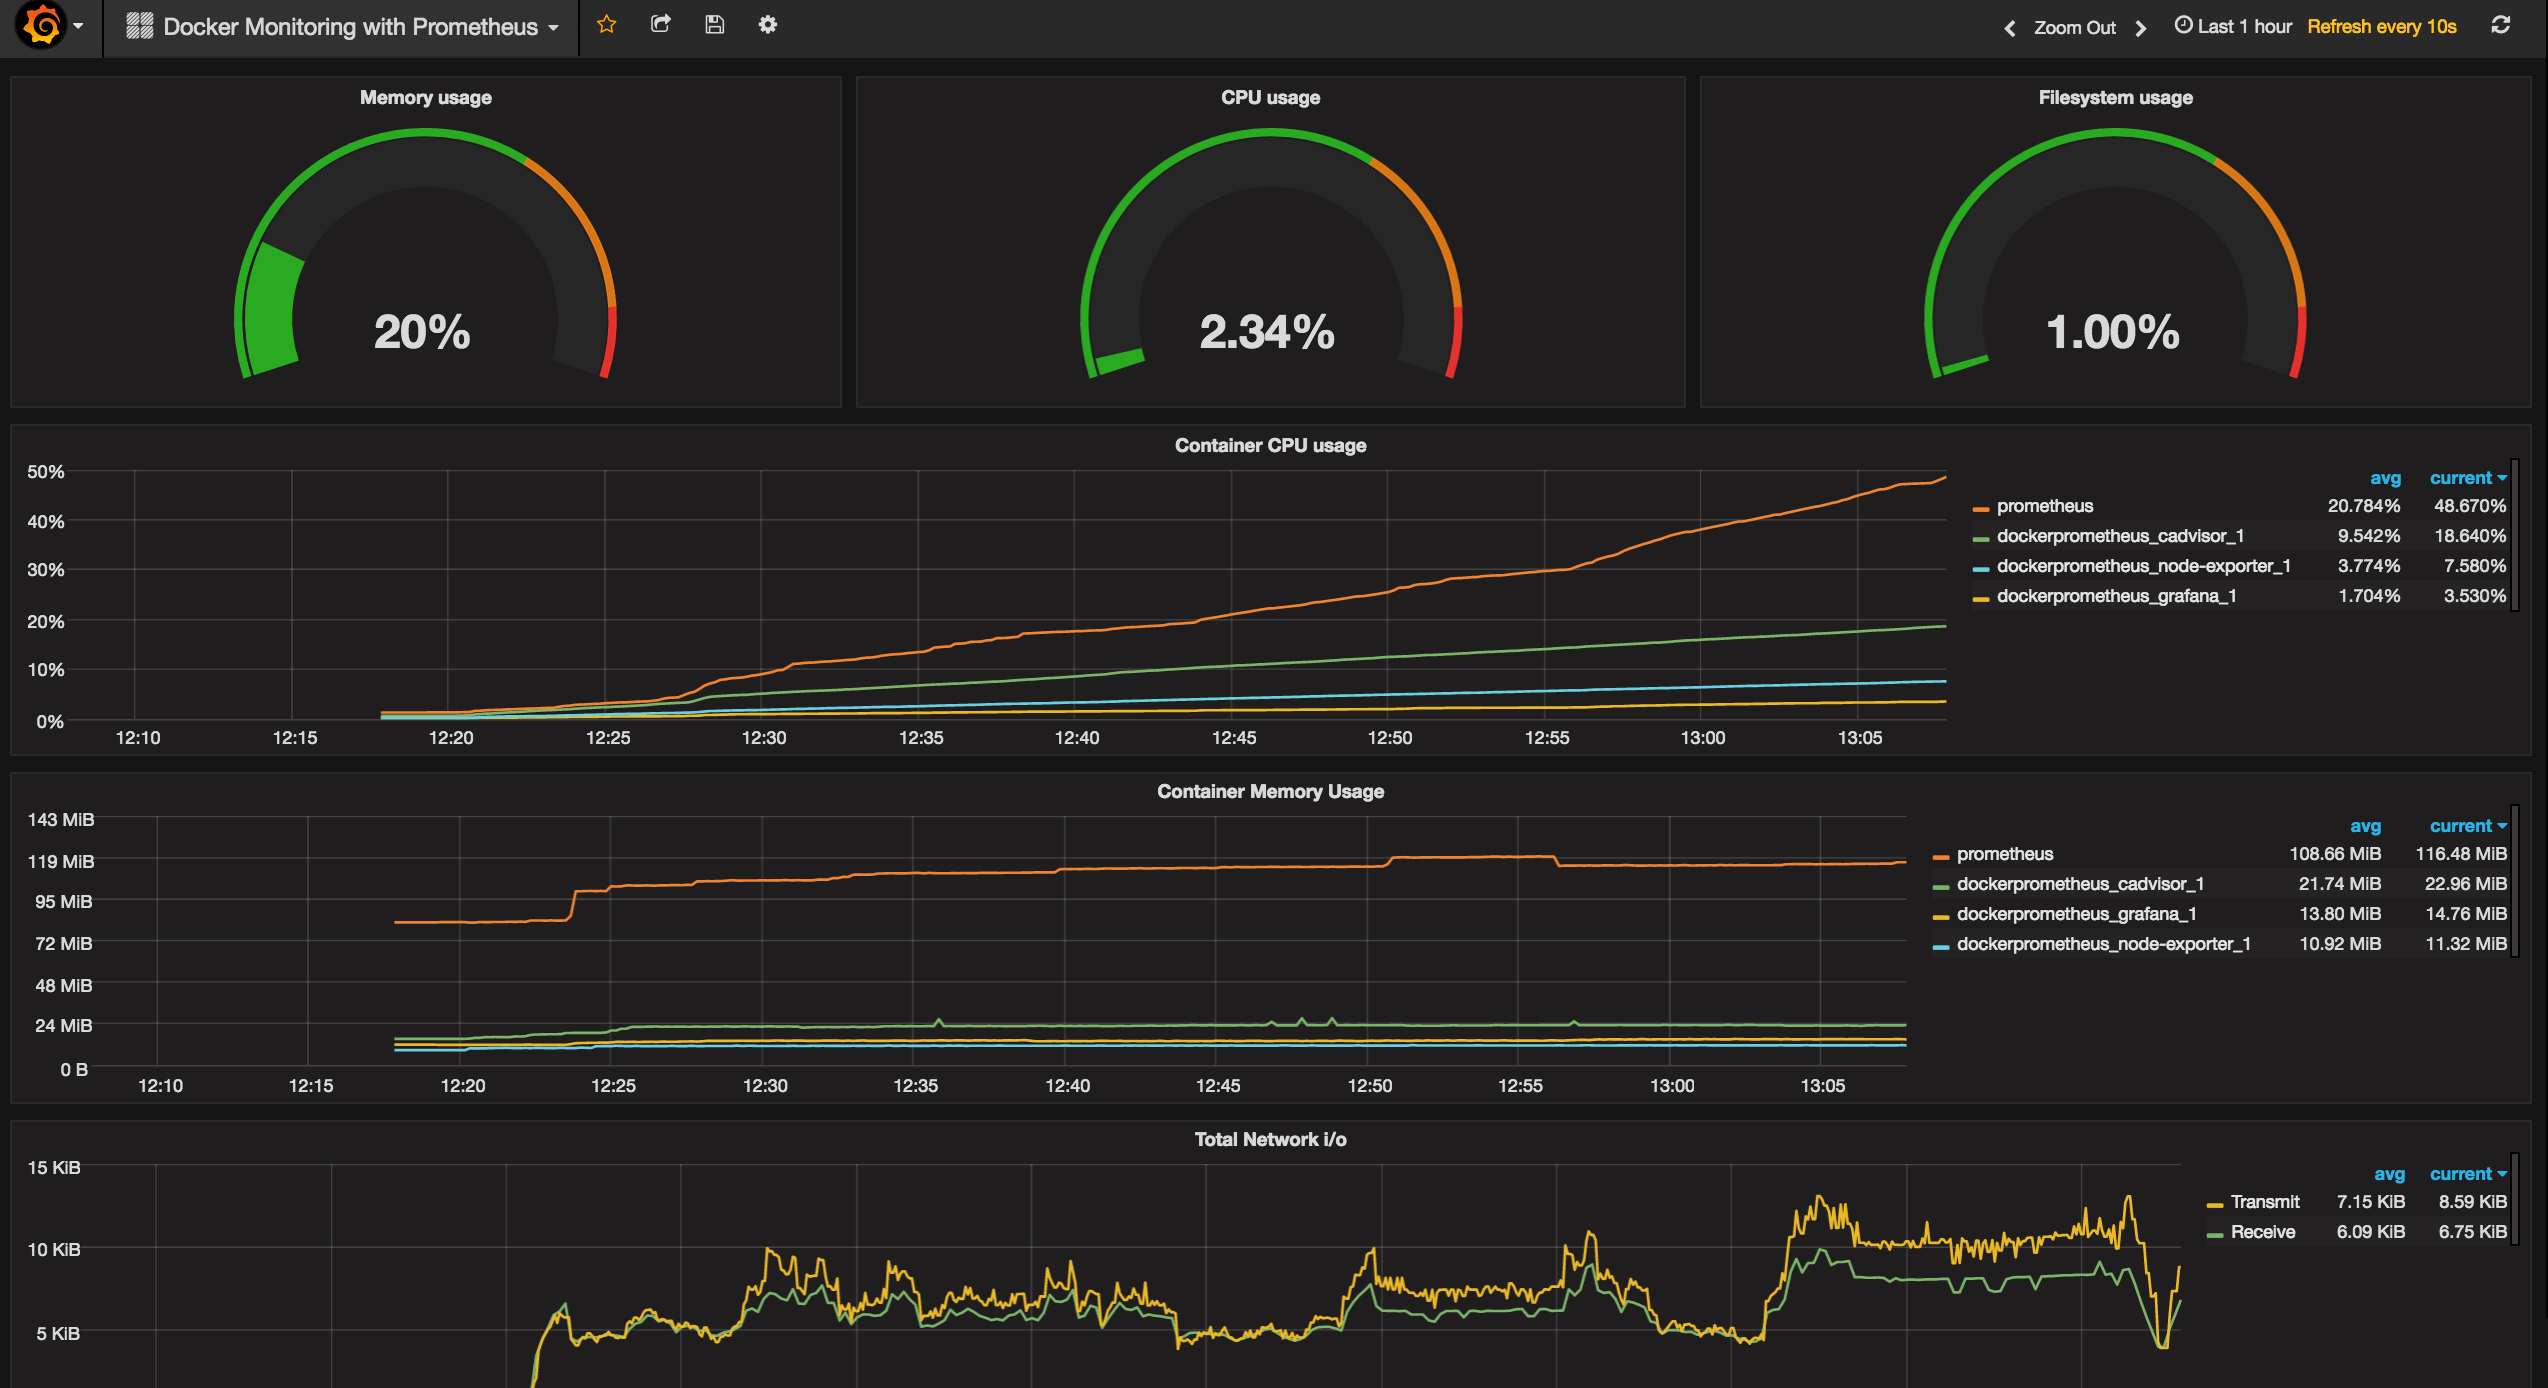
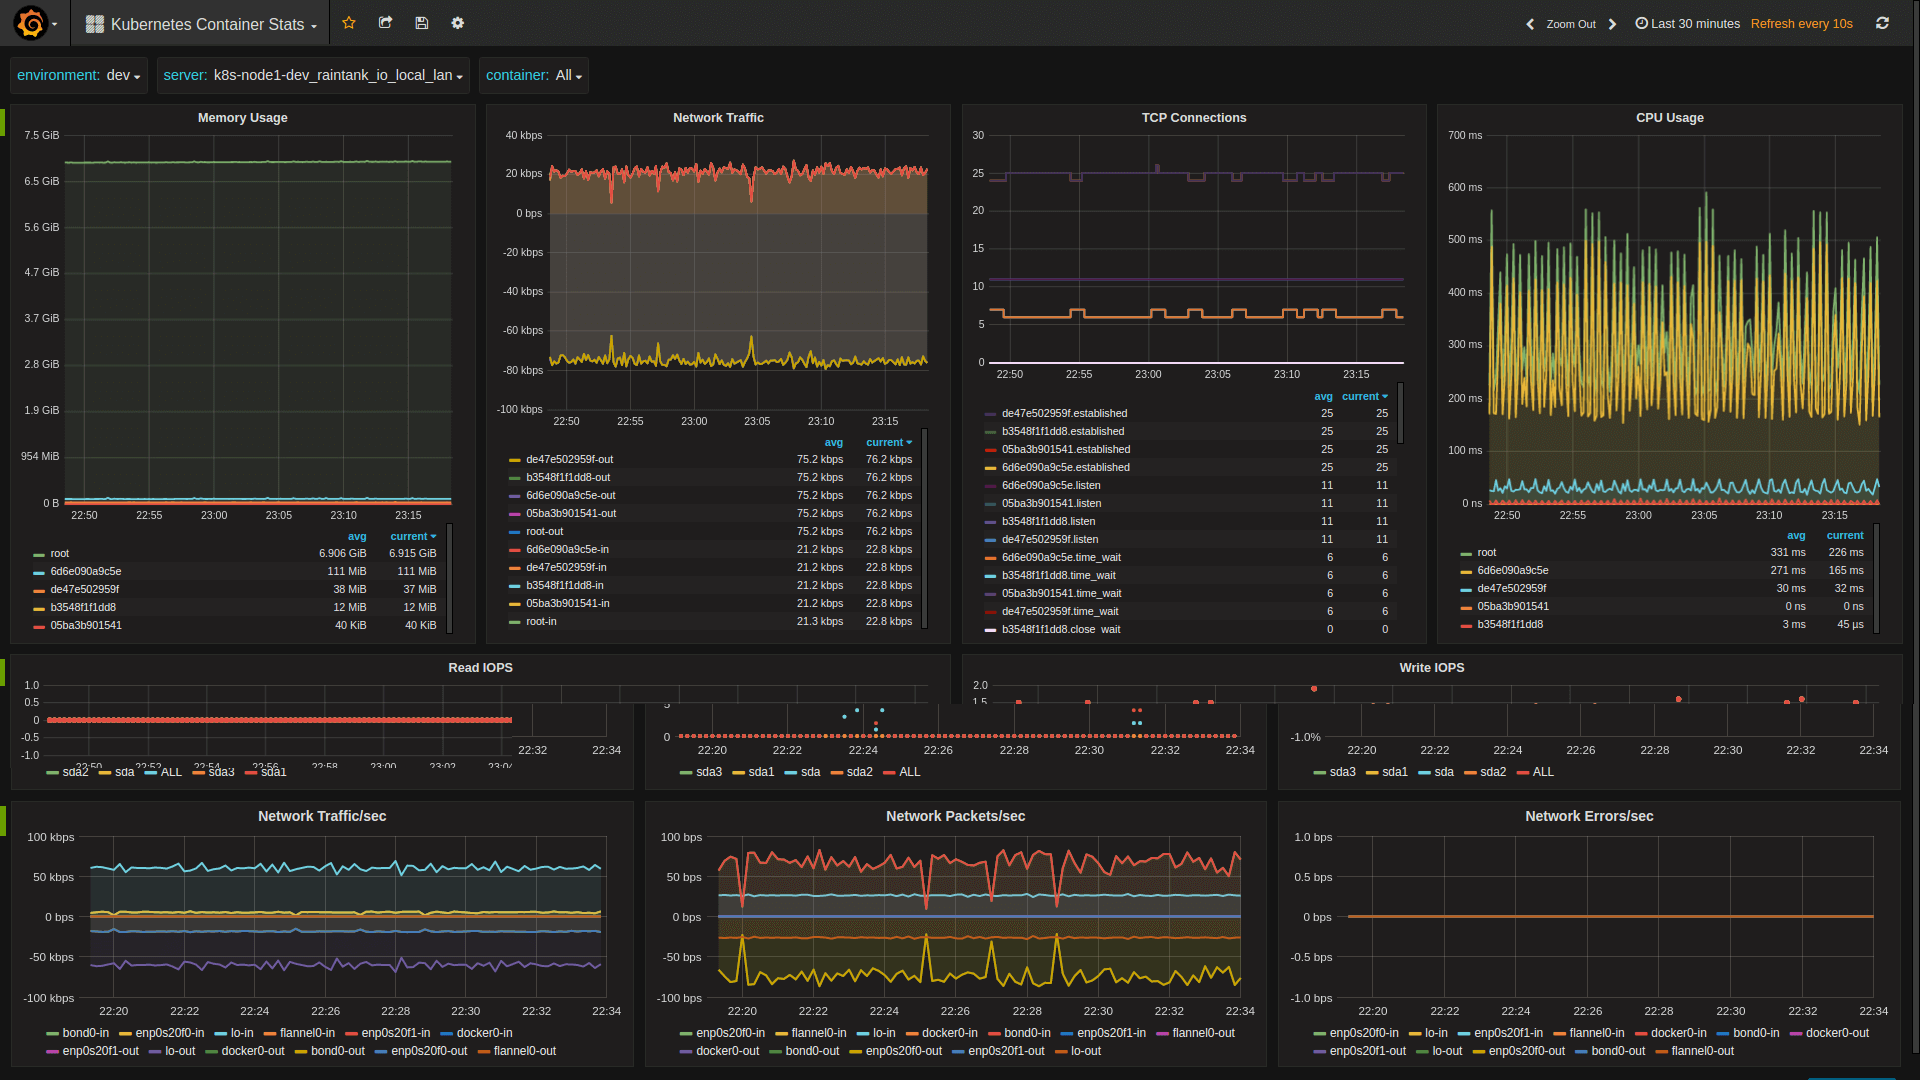
There are many more dashboards to highlight. Instead of listing them all head to [Grafana.net](https://grafana.net/dashboards?utm_source=Grafana_blog) and checkout the full list.
Thanks
Big thanks to all the passionate Grafana users and devs out there who continue to submit bug reports, feature requests and pull requests. I know we have been lagging behind on addressing PR’s lately but hope to be able to improve on that post v4 release.
Until next time, keep on graphing!
Torkel Ödegaard


