Grafana 2.6 Beta Released
Release highlights

This release adds a new panel, namely the top requested Table Panel. Yes it is finally here! The reason for the beta release status is because the release also includes a new and more powerful InfluxDB query editor. This new editor works very differently from the previous one and requires more feedback and testing before a stable release can be made.
The main documentation pages have yet to be updated with information about how to use the new table panel and the new InfluxDB editor so for now refer to this blog post for guidance.
Table Panel
The new table panel is very flexible, supporting both multiple modes for time series as well as for table, annotation and raw JSON data. It also provides date formating and value formating and coloring options.
Time series to rows
In the most simple mode you can turn time series to rows. This means you get a Time, Metric and a Value column.
Where Metric is the name of the time series.

Table Transform
Above you see the options tab for the Table Panel. The most important option is the To Table Transform.
This option controls how the result of the metric/data query is turned into a table.
Column Styles
The column styles allow you control how dates and numbers are formatted.
Time series to columns
This transform allows you to take multiple time series and group them by time. Which will result in a Time column
and a column for each time series.

In the screenshot above you can see how the same time series query as in the previous example can be transformed into
a different table by changing the To Table Transform to Time series to columns.
Time series to aggregations
This transform works very similar to the legend values in the Graph panel. Each series gets its own row. In the Options tab you can select which aggregations you want using the plus button the Columns section.

You have to think about how accurate the aggregations will be. It depends on what aggregation is used in the time series query, how many data points are fetched, etc. The time series aggregations are calculated by Grafana after aggregation is performed by the time series database.
Raw logs queries
If you want to show documents from Elasticsearch pick Raw Document as the first metric.

This in combination with the JSON Data table transform will allow you to pick which fields in the document
you want to show in the table.

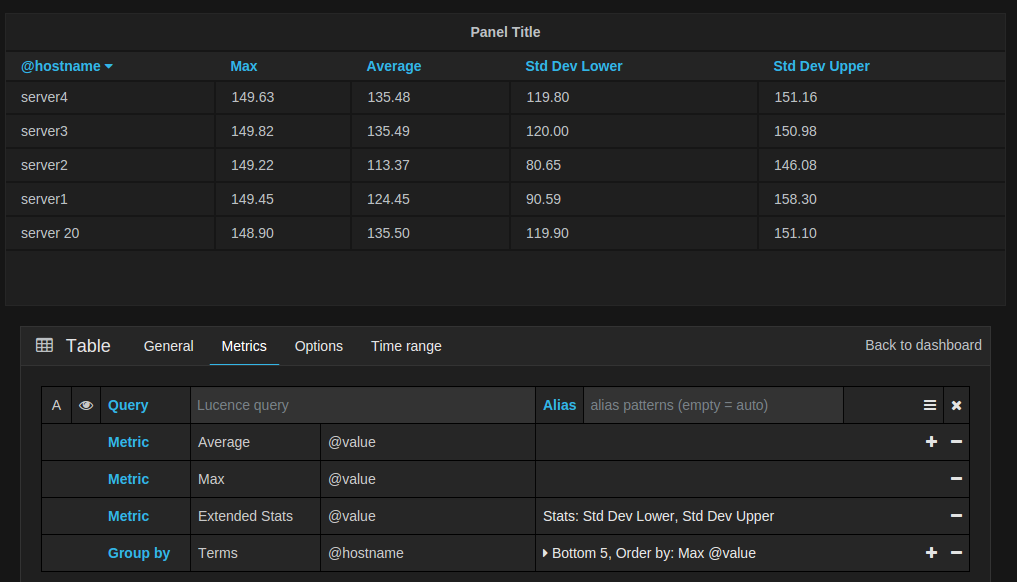
Elasticsearch aggregations
You can also make Elasticsearch aggregation queries without a Date Histogram. This allows you to
use Elasticsearch metric aggregations to get accurate aggregations for the selected time range.

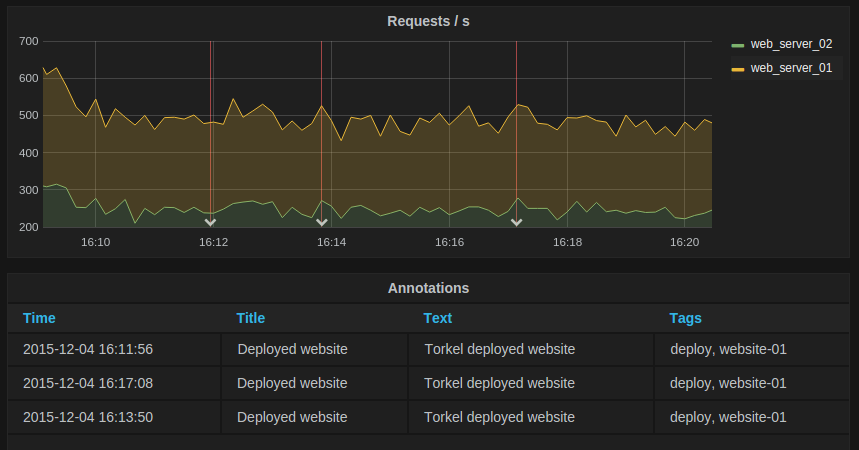
Annotations
The table can also show any annotations you have enabled in the dashboard.

The New InfluxDB Editor
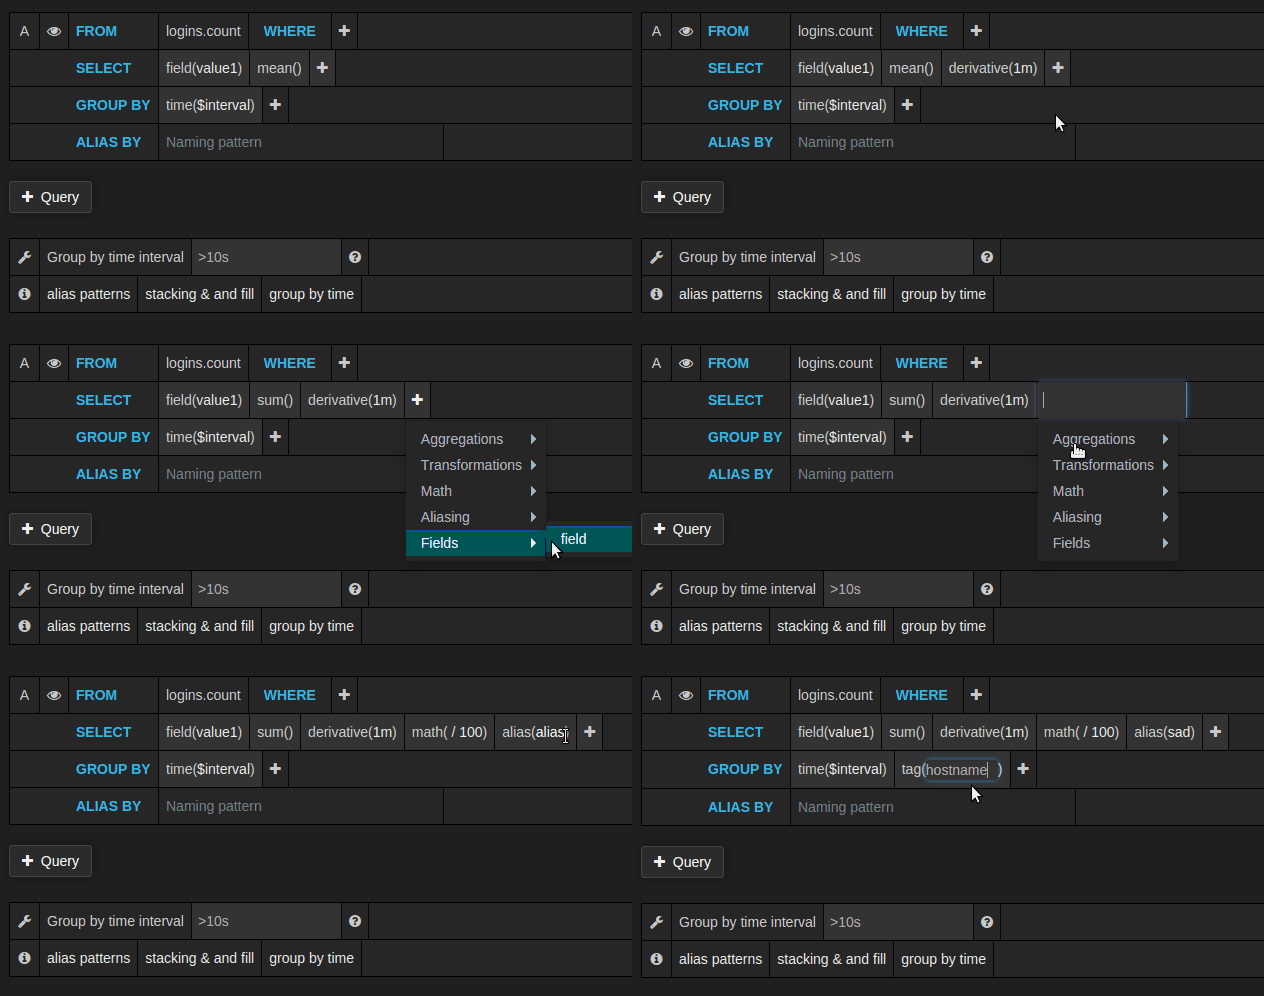
The new InfluxDB editor is a lot more flexible and powerful. It supports nested functions, like derivative.
It also uses the same technique as the Graphite query editor in that it presents nested functions as chain of function
transformations. It tries to simplify and unify the complicated nature of InfluxDB’s query language.

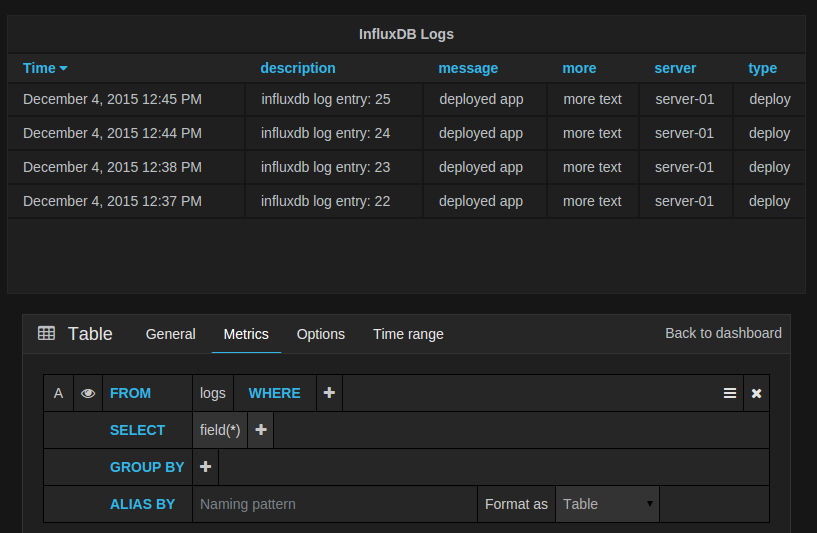
The new editor also allows you to remove group by time and select raw table data. Which is very useful
in combination with the new Table panel to show raw log data stored in InfluxDB.

Breaking changes
- Elasticsearch: Manual json edited queries are not supported any more (They very barely worked in 2.5)
Changelog
For a detailed list and link to github issues for everything included in the 2.6 release please view the CHANGELOG.md file.
Download Grafana 2.6 beta now
Demo dashboard for Grafana 2.6 features


