Grafana 2.5 Released
Release highlights

This is an exciting release, and we want to share some of the highlights. The release includes many fixes and enhancements to all areas of Grafana, like new Data Sources, a new and improved timepicker, user invites, panel resize handles and improved InfluxDB and OpenTSDB support, LDAP improvements, Graph panel units.
New time range controls

A new timepicker with room for more quick ranges as well as new types of relative ranges, like Today,
The day so far and This day last week. Also an improved time & calendar picker that now works
correctly in UTC mode.
Elasticsearch

This release brings a fully featured query editor for Elasticsearch. You will now be able to visualize logs or any kind of data stored in Elasticserarch. The query editor allows you to build both simple and complex queries for logs or metrics.
- Compute metrics from your documents, supported Elasticsearch aggregations:
- Count, Avg, Min, Max, Sum
- Percentiles, Std Dev, etc.
- Group by multiple terms or filters
- Specify group by options like Top 5 based on Avg @value
- Auto completion for field names
- Query only relevant indices based on time pattern
- Alias patterns for short readable series names
Try the new Elasticsearch query editor on the play.grafana.org site.
CloudWatch

Grafana 2.5 ships with a new CloudWatch datasource that will allow you to query and visualize CloudWatch metrics directly from Grafana.
- Rich editor with auto completion for metric names, namespaces and dimensions
- Templating queries for generic dashboards
- Alias patterns for short readable series names
Prometheus

Grafana 2.5 ships with a new Prometheus datasource that will allow you to query and visualize data stored in Prometheus.
Mix different data sources

In previous releases you have been able to mix different data sources on the same dashboard. In v2.5 you
will be able to mix them on the same graph! You can enable this by selecting the built in -- Mixed -- data source.
When selected this will allow you to specify data source on a per query basis. This will, for example, allow you
to plot metrics from different Graphite servers on the same Graph or plot data from Elasticsearch alongside
data from Prometheus. Mixing different data sources on the same graph works for any data source, even custom ones.
Panel Resize handles

This release adds resize handles to the the bottom right corners of panels making is easy to resize both width and height.
User invites

This version also brings some new features for user management.
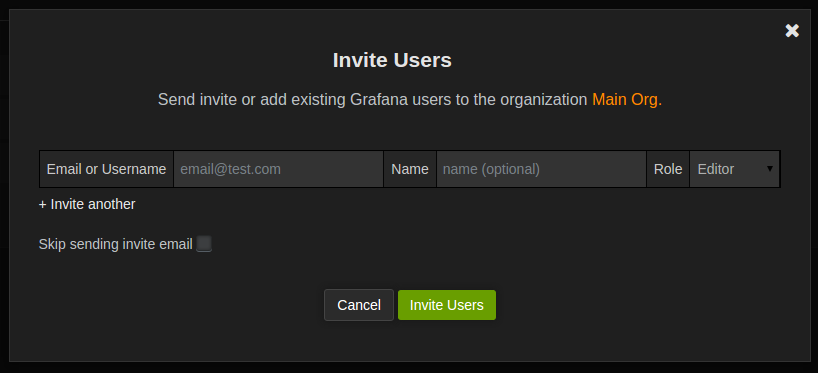
- Organization admins can now invite new users (via email or manually via invite link)
- Users can signup using invite link and get automatically added to invited organization
- User signup workflow can (if enabled) contain an email verification step.
- Check out #2353 for more info.
Miscellaneous improvements
- InfluxDB query editor now supports math and AS expressions
- InfluxDB query editor now supports custom group by interval
- Panel drilldown link is easier to reach
- LDAP improvements (can now search for group membership if your LDAP server does not support memberOf attribute)
- More units for graph and singlestat panel (Length, Volume, Temperature, Pressure, Currency)
- Admin page for all organizations (remove / edit)
Breaking changes
There have been some changes to the data source plugin API. If you are using a custom plugin check that there is an update for it before you upgrade. Also the new time picker does not currently support custom quick ranges like the last one did. This will likely be added in a future release.
Changelog
For a detailed list and link to github issues for everything included in the 2.5 release please view the CHANGELOG.md file.
What’s next for Grafana?
If this release does not excite you then maybe the next one will. Starting next week work on integrating alerting into Grafana, in a non-intrusive and composable way, will begin. We have already spent a lot of time discussing this feature with the Grafana user community, done UI mock ups, etc. You can join the discussion and view mocks ups at Issue #2209. Another top priority will be a table panel and more ways to visualize metrics.


