That's a wrap on ObservabilityCON on the Road London
Agenda
Opening keynote
Join Grafana Labs Chief Technology Officer Tom Wilkie for the kickoff of ObservabilityCON on the Road London. Learn about the latest features and AI/ML developments in the Grafana LGTM Stack and Grafana Cloud that make it easier and faster for you to identify and resolve issues and get value from your observability practice.- Tom Wilkie, Chief Technology Officer, Grafana Labs
Instrumentation and ingestion in an instant: Demo of Grafana Alloy, Grafana Beyla, and OpenTelemetry
Grafana Alloy, our open source telemetry collector, uniquely provides native pipelines for both OpenTelemetry and Prometheus formats. With Alloy’s integration with Grafana Beyla for eBPF-based application auto-instrumentation, you can automatically capture metrics and traces of running services and connect them to your existing telemetry pipelines. Alloy also has an experimental feature for translating Datadog metric formats into native OTLP format. In this session, you’ll see a live demo of how, with a single deployment, you can instantly get your data into Grafana Cloud for unified application and infrastructure observability.- Tom Braack, Software Engineer, Grafana Labs
- Mario Macías, Senior Software Engineer, Grafana Labs
Troubleshoot faster with unified application and infrastructure observability in Grafana Cloud
At ObservabilityCON 2023, we announced the acquisition of Asserts, which provides an intelligence layer to telemetry data to help you understand the behavior of your applications and services. In this session, you’ll see a live demo of how these contextual alerts have been integrated into Grafana Cloud’s workflows for application, Kubernetes, and infrastructure observability – and more – to speed up root cause analysis.- Daniel Fitzgerald, Staff Solutions Engineer, Grafana Labs
- Alex Ramos, Senior Software Engineer, Grafana Labs
How Dexory scaled observability for its fleet of autonomous robots with Grafana Cloud
Dexory helps customers solve their warehouse visibility gaps using autonomous data collection robots – but how does it manage its own observability challenges? Join Dexory VP of Software Matt MacLeod as he shares Dexory’s journey of building a monitoring platform with Grafana Cloud to support the scaling of its fleet of robots. You’ll learn how Dexory achieved global visibility across dozens of customer sites, empowered technology teams to take control of their observability, and implemented predictive maintenance to enhance operations.- Matt MacLeod, VP Software Systems, Dexory
AI/ML in Grafana Cloud: Saving toil, time, and money
Under the hood of features like Sift, Asserts, and Adaptive Metrics, AI/ML is helping organizations reduce toil, get faster insights, optimize observability costs – and level up the productivity of their engineers. In this session, you’ll see demos of these Grafana Cloud features and hear real-world examples of the value achieved with them. Plus find out what’s next for the Adaptive Telemetry cost management suite: Adaptive Logs and beyond.- Poyzan Taneli, Senior Software Engineer, Grafana Labs
- Dave Russell, Director, Voice of the Customer, Grafana Labs
Building a Generative AI Assistant for Grafana Cloud: Harnessing the Power of Amazon Bedrock
This talk is ideal for cloud architects, DevOps engineers, and AI enthusiasts looking to harness the power of generative AI for enhanced system observability. Attendees will gain valuable insights into building, deploying, and maintaining advanced AI assistants in AWS Cloud, with a specific focus on integration with Grafana Cloud. This session is presented by platinum event sponsor AWS.- Ayman Salama, Senior Partner Solutions Architect, AWS
A user's guide to Grafana Cloud's end-to-end IRM solution
Grafana Cloud’s Incident Response and Management solution provides workflows that span creating alerts and SLOs, managing on-call and incident response, and learning from postmortems – all within the context of your observability stack. In this session, you’ll learn best practices for making the most of this IRM solution, including leveraging the historical incident data that’s accessible within Grafana Cloud.- Vadim Stepanov, Software Engineer, Grafana Labs
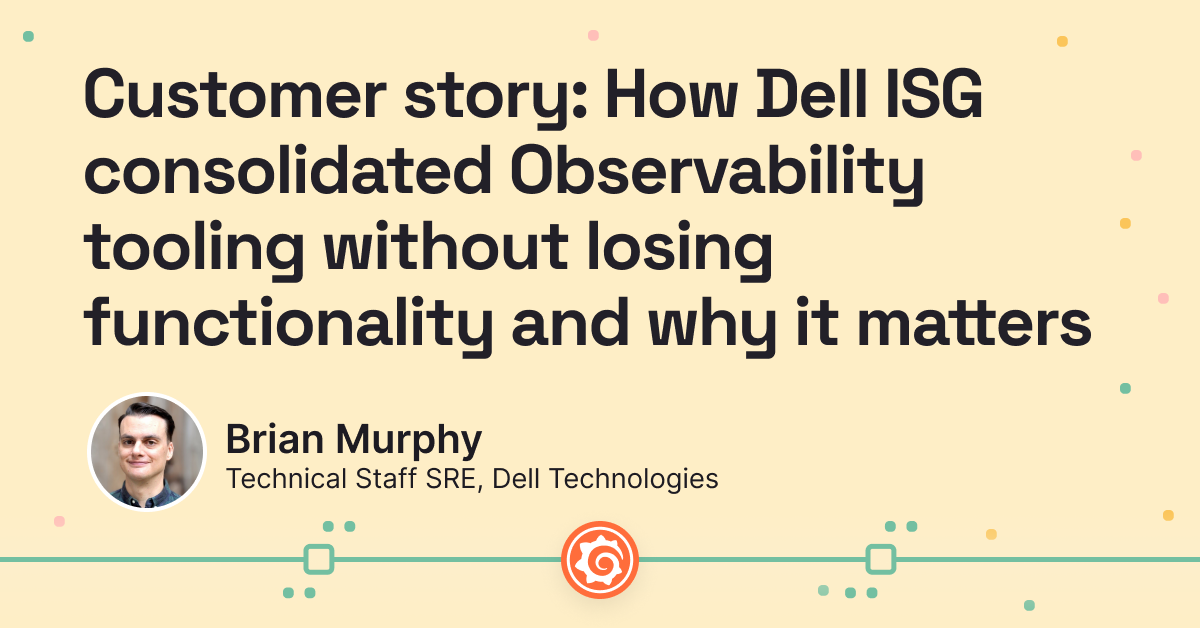
How Booking.com redefined agnostic observability with Grafana Labs
One of the world’s largest travel marketplaces, Booking.com needed to navigate beyond fragmented and siloed monitoring towards a cohesive, cutting-edge, agnostic observability ecosystem. Join Solutions Architect Murugesan Ramaiah and Site Reliability Engineer Ahmadali Shafiee to learn how the company uses Grafana Labs observability to make it easier for engineering teams to observe and act on what matters most.- Murugesan Ramaiah, Solutions Architect, Booking.com
- Ahmadali Shafiee, Site Reliability Engineer, Booking.com
Best practices for faster insights from your metrics, logs, traces, and profiles
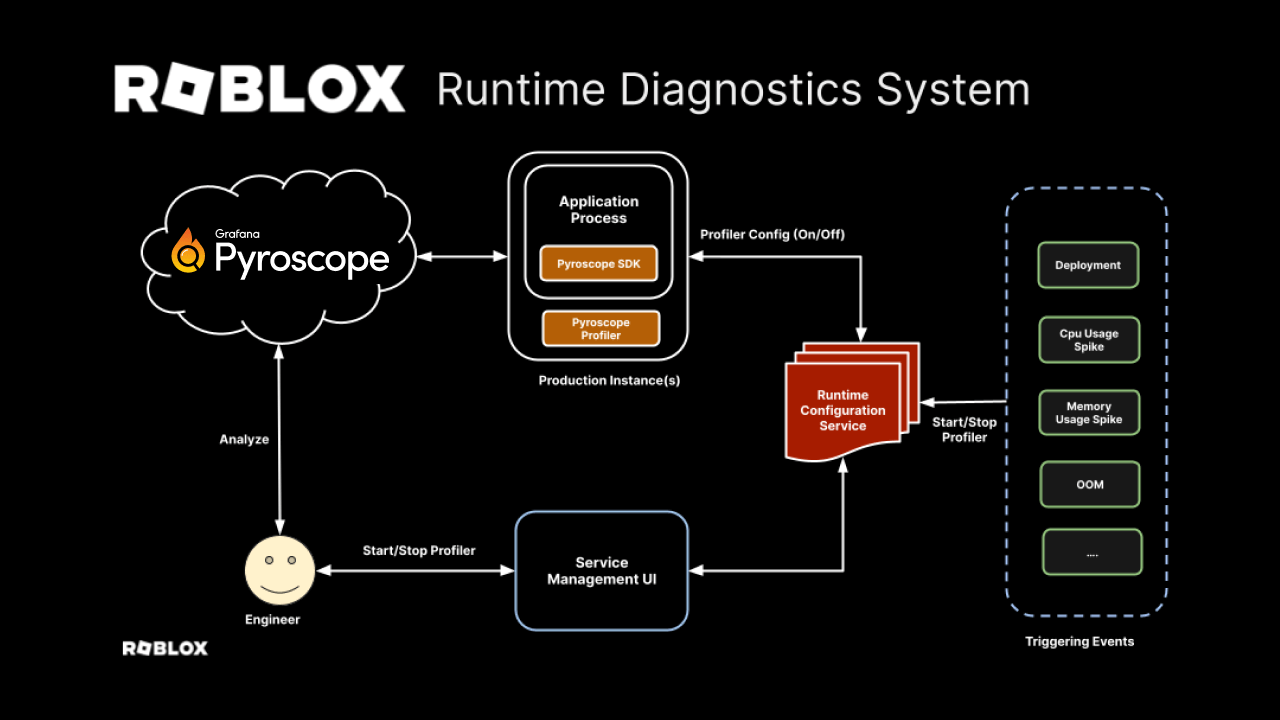
Learn about the latest features and functionality in Grafana Labs’ horizontally scalable, highly performant open source telemetry backends (Grafana Mimir for Prometheus metrics, Grafana Loki for logs, Grafana Tempo for traces, and Grafana Pyroscope for profiles). In this session, you’ll learn best practices for correlating your different telemetry data in Grafana to simplify debugging, speed up incident resolution, and understand resource usage and latency down to the code level. You’ll also see a demo of the new Explore features that remove the barrier of learning query languages like PromQL and LogQL.- Joey Tawadrous, Senior Software Engineer, Grafana Labs
- Dave Russell, Director, Voice of the Customer, Grafana Labs
How to use synthetics, load testing, and real user monitoring to understand your end users' experience
Synthetic monitoring, which enables you to simulate and analyze user journeys, is a common starting point for understanding and improving your end users’ digital experience. In this session, you’ll find out about the latest developments in Grafana Cloud Synthetic Monitoring, powered by Grafana k6, that help you simulate even the most complex transactions and user journeys. You’ll also learn how synthetics can be used in conjunction with load testing and real user monitoring in Grafana Cloud for a more holistic approach to user-centered observability.- Chris Bedwell, Senior Software Engineer, Grafana Labs
Not what you were looking for?
Find a Grafana Labs event near you
From local meetups to virtual webinars and in-person events, there’s plenty more to explore. Visit our events home page or sign up to get notified any time Grafana Labs hosts an event near you.
See all events


