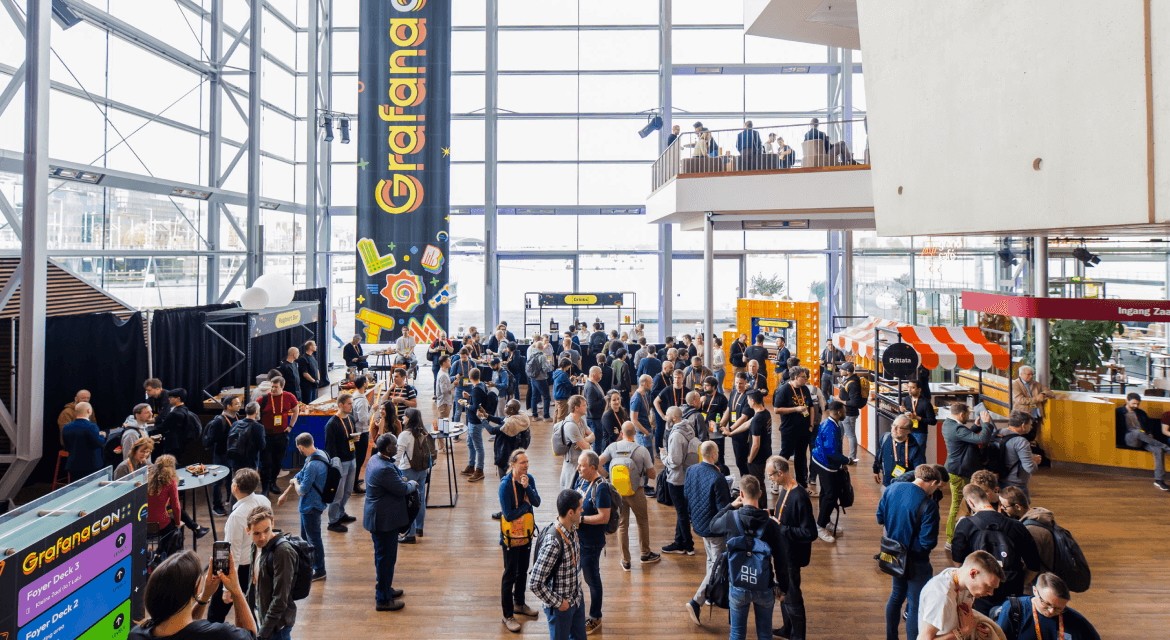
That’s a wrap on GrafanaCON 2024!

Sign up to get notified about future events and product updates

Catch up on all the announcements

Read recap blog post →

Watch on-demand videos

Filter On-demand sessions
GrafanaCON 2024 keynote
Join us for the kickoff of the conference, the presentation of the Golden Grot community dashboard awards, some exciting announcements around our open source observability projects, and an overview of what’s new in Grafana 11.
  • Raj Dutt CEO, Co-Founder
    Grafana Labs
  • Torkel Ödegaard CGO, Co-Founder
    Grafana Labs
  • Carl Bergquist Principal Software Engineer
    Grafana Labs
  • Mihaela Maior Director of Engineering
    Grafana Labs
  • Stephanie Hingtgen Senior Software Engineer
    Grafana Labs
  • Owen Diehl Principal Software Engineer
    Grafana Labs
  • Paschalis Tsilias Senior Software Engineer
    Grafana Labs
  • Cyril Tovena Principal Software Engineer
    Grafana Labs
Grafana in space: Monitoring Japan's SLIM moon lander in real time
On January 19, Japan became the fifth country to land on the moon – and Grafana was there! Learn how the Japanese space agency uses Grafana for its real-time status monitoring system for science satellites and probes, including the SLIM moon lander.
  • Satoshi Nakahira Associate Senior Researcher
    ISAS/JAXA
5 years in, Loki turns 3.0
Grafana Loki was announced at the end of 2018, and five years later, the popular logging project is releasing version 3.0. Find out about the major release – native OTel support, bloom-filter query acceleration, and more – as well as what’s ahead.
  • Owen Diehl Principal Software Engineer
    Grafana Labs
  • Cyril Tovena Principal Software Engineer
    Grafana Labs
Grafana 11 deep dive
You’ve seen the highlights; now let’s get into the details of what makes Grafana 11 a better way for you to connect to your data, visualize it, share it with others, and respond to incidents. See demos of some of our favorite features.
  • Mihaela Maior Director of Engineering
    Grafana Labs
  • Mitch Seaman Director of Product
    Grafana Labs
How Planted ramps up food production faster with Grafana's single pane of glass
Learn how the plant-based food company utilizes Grafana to monitor all production data, and how plugins allow them to collect human input through the data manipulation panel, analyze images, and even control machines through API calls with the Infinity plugin.
  • Mathias Pawlowsky Head of Data Science
    Planted
Introducing Grafana Alloy, a distribution of the OTel Collector
Learn the core concepts around Grafana Alloy, Grafana Labs’ new distribution of the OpenTelemetry Collector.
  • Matt Durham Senior Software Engineer
    Grafana Labs
  • Paschalis Tsilias Senior Software Engineer
    Grafana Labs
Grafana Beyla: Zero-code distributed traces and metrics for your microservices with eBPF
Watch a demo of Grafana Beyla, our state-of-the-art answer to instrumentation with eBPF. You’ll learn how to get distributed traces and RED metrics on a Kubernetes cluster with applications written in multiple languages and application protocols.
  • Mario Macías Senior Software Engineer
    Grafana Labs
All about the Amazon CloudWatch data source
Learn about the latest features of the Amazon CloudWatch data source in Grafana, tips to improve query performance, and how to navigate between CloudWatch metrics and CloudWatch logs.
  • Faisal Shahdad Senior DevOps Consultant
    AWS
OpenTelemetry Looks Good To Me: Loki, Grafana, Tempo, Mimir
In this lightning talk, get an introduction to Loki for logs, Tempo for traces, and Mimir for metrics by using two simple Java applications, OpenTelemetry, and Grafana dashboards.
  • Clément Boudereau Principal Engineer
    D-EDGE
How CERN monitors the world's largest computing grid with Grafana and Mimir
CERN data centers serve as the core tier of the world’s largest computing grid (WLCG), with the accumulated power of about 1.4 million computer cores. Find out how it leverages Grafana and Mimir for its essential monitoring.
  • Nikolay Tsvetkov Staff Computing Engineer
    CERN
IoT on your smartphone: Visualizing mobile sensor data with Grafana
Ever thought of using your smartphone as an IoT device? With your phone’s built-in sensors, such as gyroscopes, accelerometers, and magnetometers, you could monitor everything from personal health to environmental conditions. Learn how in this session.
  • Guillermo Ruiz Senior Developer Advocate
    AWS
Observing smart robots with OpenTelemetry and the LGTM Stack
The AIVA Robotic System is a solution for remote control, automation, and testing of devices such as infotainment systems. The team used OpenTelemetry and the Grafana LGTM Stack to gain visibility into every part of the deployment, down to the robot’s firmware.
  • Tomáš Grbálik Software Engineer
    YSoft
4,000 dashboards of beer on the wall: Monitoring Heineken's connected breweries with Grafana and advanced analytics
At 85 Heineken connected breweries across the globe, more than 4,000 Grafana dashboards help the manufacturing teams monitor, compare, and improve operational efficiency. Find out how Grafana enables advanced analytics in Heineken’s industrial IoT platform.
  • Dolf Noordman IIoT Engineer
    Schuberg Philis
  • Frank Van Boven Mission Critical Engineer
    Schuberg Philis
Panel: Designing and building OSS observability tools in the open
Listen in as members of the Grafana Labs engineering, product, and UX teams answer your questions and share the highs and lows, best practices and lessons learned from designing and building open source observability tools.
  • Teddy Bartha UX Designer
    Grafana Labs
  • Carl Bergquist Principal Software Engineer
    Grafana Labs
  • Dee Kitchen VP, Engineering
    Grafana Labs
  • Mihaela Maior Director of Engineering
    Grafana Labs
  • Goutham Veeramachaneni Product Manager
    Grafana Labs
  • Ryan Perry Principal Product Manager
    Grafana Labs
  • Mat Ryer Principal Software Engineer
    Grafana Labs
A user's guide to the open source Grafana App Platform
Based on the lessons learned from building and running the SLO app, Grafana Labs has launched the open source Grafana App Platform to help developers create similarly complex apps tightly integrated with Grafana. Learn about the platform’s capabilities.
  • Stephanie Hingtgen Senior Software Engineer
    Grafana Labs
  • Ryan McKinley Distinguished Engineer
    Grafana Labs
How we built a complex SLO app tightly integrated with Grafana
Our Grafana Cloud SLO app helps users create SLOs and incorporate them into their DevOps practice. Hear about the best practices learned from building and deploying a complex app that’s also tightly integrated with Grafana.
  • Joe Blubaugh Principal Software Engineer
    Grafana Labs
Building interactive Grafana dashboards for business intelligence
The Grafana Labs product analytics team loves testing the limits of Grafana dashboards for internal analytics and business intelligence! This session will showcase tips and tricks for building interactive BI dashboards that are easily explored even by non-technical users.
  • Chris Shih Director of Analytics
    Grafana Labs
Infinity and beyond: The future of Grafana's data source ecosystem
Learn how the Infinity plugin enables users to get data from any source into Grafana – and allows us to quickly expand our catalog of data sources.
  • Andriy Urbanas Senior Software Engineer
    Grafana Labs
  • Sriramajeyam Sugumaran Senior Software Engineer
    Grafana Labs
Where DevOps meets QA: An observability and synthetic testing success story
Goal: to monitor transactions and proactively test uptime. Hear how the DevOps and QA teams at GWI achieved synthetic monitoring by leveraging k6, the Grafana LGTM Stack (Loki, Grafana, Tempo, and Mimir), and an advanced Prometheus alerting mechanism.
  • Ioannis Papadakis Director of QA
    GWI
  • Dionysis Tsoumas Director of DevOps
    GWI
From silence to signals: Data management and monitoring at The National Library of the Netherlands
To secure its mission to preserve and provide Dutch literature for the digital age, The National Library of the Netherlands made a major shift from a static data environment to an interactive, signal-rich monitoring platform with Grafana, Mimir, and Loki.
  • Gerard van Engelen Platform Engineer
    Codepeople
The evolution of Grafana Alerting
From its origins as a dashboard feature to its growth into a full-fledged alerting system, Grafana Alerting is evolving still. Get tips and tricks on getting the most out of it today, and find out what’s next.
  • Jean-Philippe Quéméner Senior Software Engineer II
    Grafana Labs
  • Alex Weaver Senior Software Engineer
    Grafana Labs
Grafana plugin development for beginners
Grafana plugins enable developers to provide new ways to connect or visualize data, including out-of-the-box monitoring experiences with applications and Scenes. In this beginner session, learn how to create a new plugin for Grafana and publish it to the catalog.
  • Marcus Andersson Senior Software Engineer
    Grafana Labs
  • David Harris Senior Product Manager
    Grafana Labs
How visualizing logs converted to traces can uncover performance problems
Learn how to transform log files into custom traces to track down problems. Tools like Promtail, Loki, logcli, and trace visualization in Grafana can be used to find issues in an uncommon way if the common way is not good enough.
  • Cees Bos Software Engineer and SRE
    OpenValue
AI/ML + Grafana: How to create intelligent Grafana apps leveraging LLMs
Find out how to leverage the power of large language models (LLMs), as well as other AI/ML-powered Grafana features, to create intelligent, dynamic experiences within Grafana Scenes apps.
  • Nathan Marrs Tech Lead
    Grafana Labs
Operations report: Running Loki on different on-prem environments
Find out how to evaluate Loki sizing, get the most out of Loki’s feature set on-premises while maintaining the benefit of its simple and robust operations model, and compile an appropriate deployment package by constantly supporting upstream-only development around the Loki Operator.
  • Robert Jacob Senior Software Engineer
    Red Hat
Grafana at continental scale: Monitoring the National Ecological Observatory Network (NEON)
This ecological monitoring network of 47 terrestrial and 34 aquatic field sites across the U.S. collects 5 billion data points per day, and Grafana dashboards monitor every sensor onsite alongside its supporting IT infrastructure.
  • Robert Hamnett IT Service Administrator IV
    National Ecological Observatory Network
Obirdability: Building an observability system for bird songs
You can use open source observability technologies such as Prometheus, Loki, and Grafana to monitor birds and learn more about their songs and various factors that influence them, such as weather, pollution, and seasonality.
  • Sven Großmann Senior Software Engineer II
    Grafana Labs
  • Ivana Huckova Senior Software Engineer
    Grafana Labs
No need to wait to meet and mingle

No need to wait to meet and mingle

Stop by and say hi in the #grafanacon channel
Join the conversation in Slack ➞
Explore all the latest releases

Explore all the latest releases

See what happened at GrafanaCON 2023

Opening Keynote
Get started with home automation with Raspberry Pi and Grafana Cloud
Reducing data center energy usage with Grafana: A green IT success story