
Oracledb
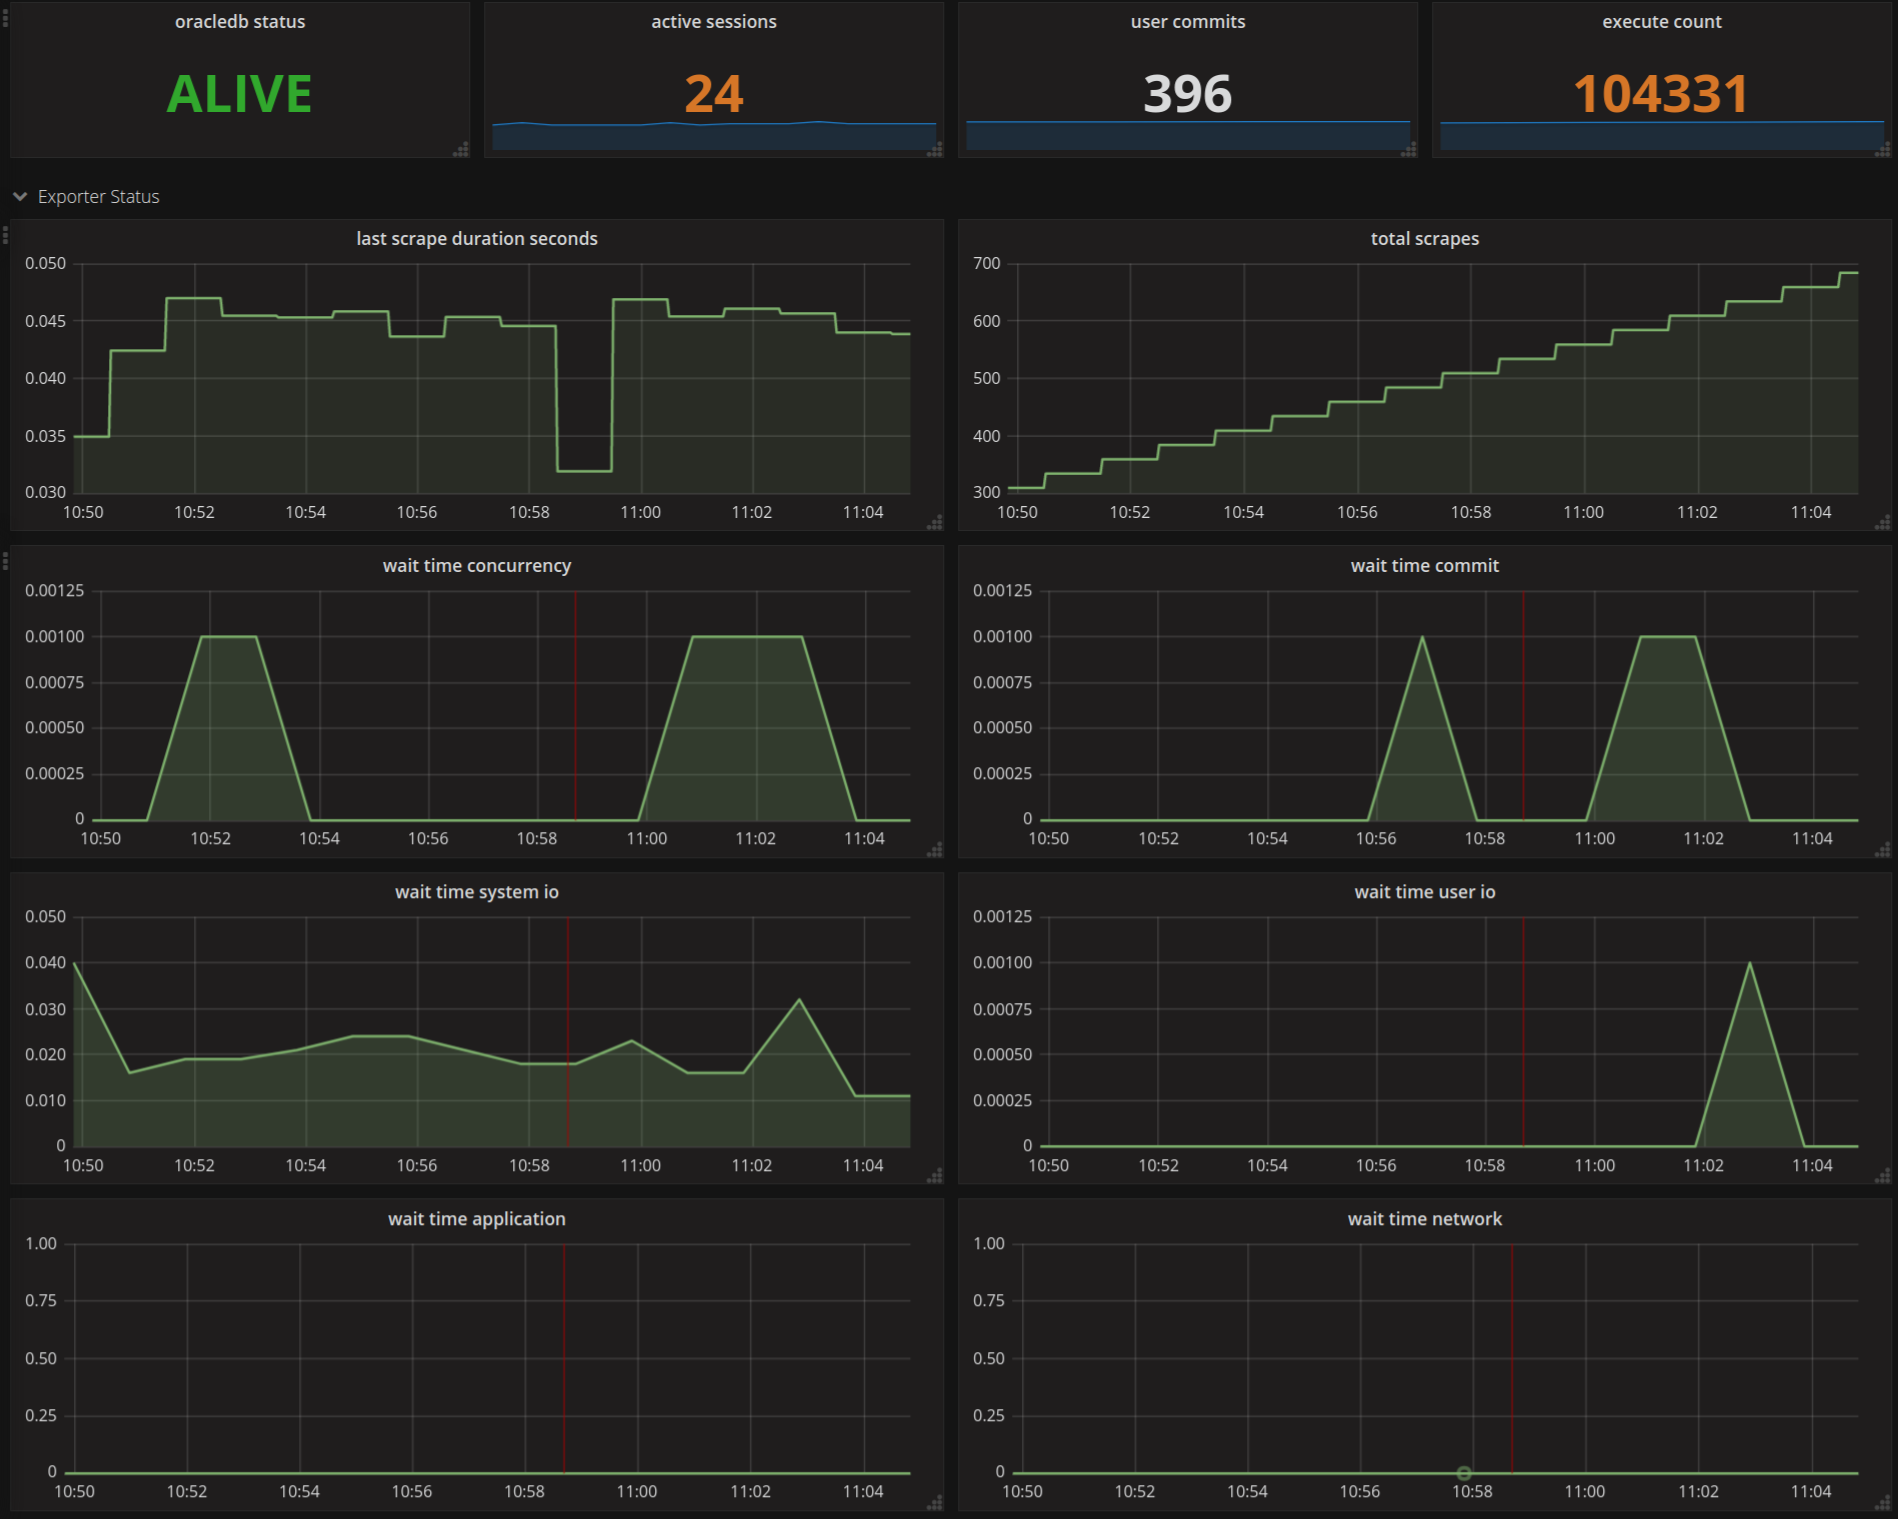
Oracle dashboard monitors db status, active sessions, user commits, wait times and more.

The Oracle DB Dashboard uses Grafana and Prometheus to easily monitor key health parameters of an active oracle database. See screenshot below for examples of metrics monitored.
Data source config
Collector type:
Collector plugins:
Collector config:
Dashboard revisions
Upload an updated version of an exported dashboard.json file from Grafana
| Revision | Decscription | Created | |
|---|---|---|---|
| Download |
Sign up for Grafana Cloud

Get up and running in minutes with the Grafana Cloud free tier, which includes free forever 10k metrics, 50GB logs, 50GB traces, 500 VUh, and more.
Get this dashboard
Data source:
Dependencies: